

Next: Synthetic data examples
Up: Separate-offset Prestack migration
Previous: Analytical approximations of ph
Once the offset ray parameter (ph), or an approximation of it,
is determined, it is then used, along with
equation (18), to calculate traveltime (phase shifts).
What makes zero-offset migration so trivial is that ph is known in advance (ph=0), and therefore,
traveltime calculation can be done directly. For prestack migration, we must first estimate ph
then precede with traveltime calculations. Although ph above can be
evaluated using analytical approximations,
the phase will always be evaluated by inserting the value of ph into the exact DSR equation
[i.e., equation (18)].
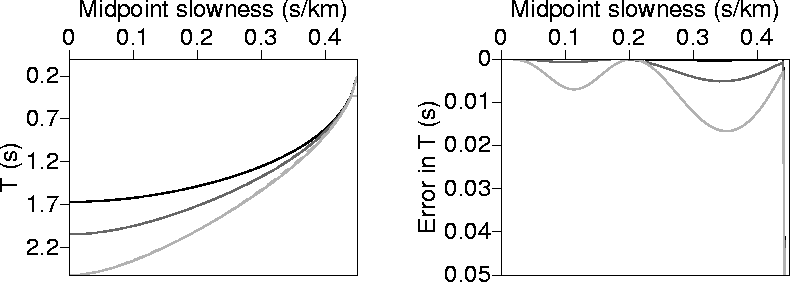
t2eta0m
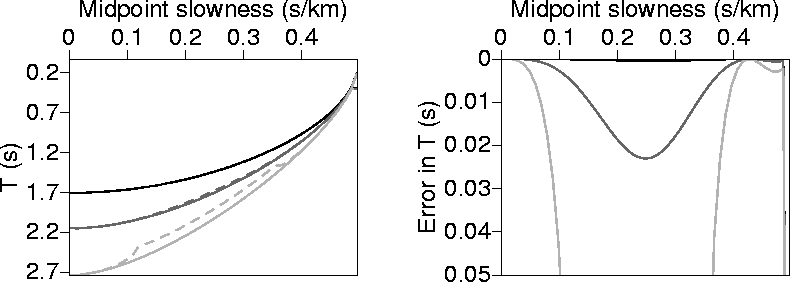
Figure 3 Left: the phase correction, T, as a function px using ph calculated numerically
(solid curve), and ph calculated using the 2-point solution (dashed curve). Right: The absolute difference
between each of the two curves (numerical and analytical) on the left. The medium is homogeneous and isotropic with v=2.0 km/s.
The black curve corresponds to an offset-to-vertical-time ratio ( ) of 1.0 km/s,
the dark-gray curve corresponds to
 =2.0 km/s, and the light-gray curve corresponds to
  =3.0 km/s.

Figures 3 through 7 compares T [where  constitutes the phase
of the integral of equation (14)]
evaluated using numerical solutions
of ph with those obtained via analytical approximations using either the 2-point,
the 3-point, or perturbation-theory solutions of ph.
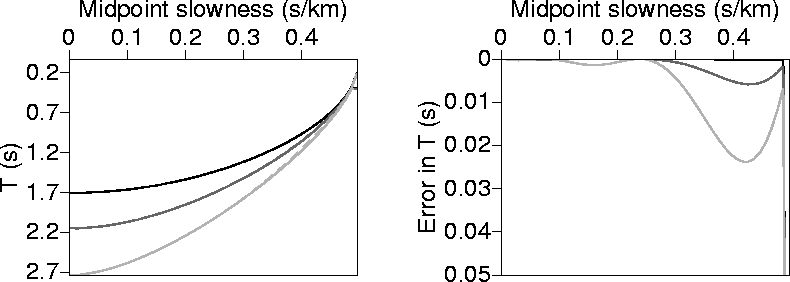
For isotropic homogeneous media, T calculated using the 3-point solution of ph better approximates
the T derived from the numerical solutions than that given by the 2-point solution (compare
Figures 3 and 4).
As expected, errors will increase, for all cases, with increasing offsets. However,
because  =3 km/s [offset-to-depth ratio (X/D) of 3]
is rarely encountered in practice, and usually falls far within the typical mute zone, these
approximations
yield fairly accurate phase shifts even for practical large offsets.
The irregularity in the T curve in
Figure 3, for ph calculated using the 2-point solution and
  km/s, is a result of enforcing
the condition that
  , which is necessary to
avoid imaginary values in the DSR equation.
t3eta0m
Figure 4 Same as in Figure 3, but now we are comparing the numerical solution with
that obtained for ph calculated using the analytical 3-point fitting
equation.

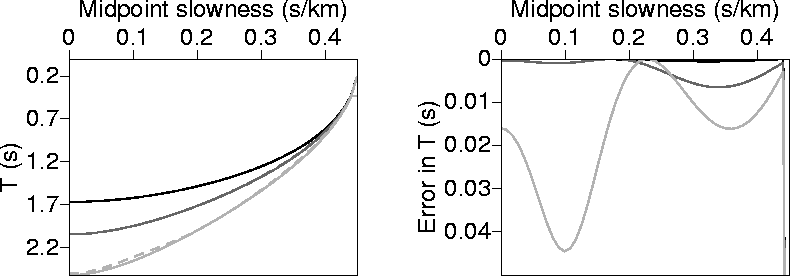
t2eta2m
Figure 5 Same as in Figure 3, but the medium now is VTI with
 =0.2.
=0.2.

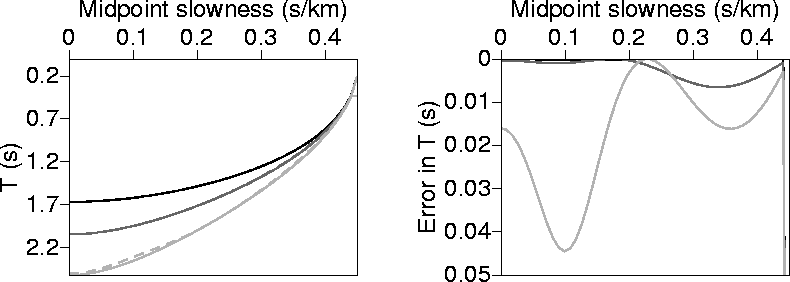
In VTI media, only for  =1 km/s, the T derived using the 3-point solution
better approximates the numerical solution than T derived using the 2-point solution
(compare Figures 5 and 6). The degradation of the 3-point solution
at large offsets can be attributed to the
failure of the px=ph fitting approximation to improve the results for such offsets.
For large offsets we are approaching the validity limit of the 3-point solution.
A strict condition is enforced upon
the ph derived from setting px=ph (see Appendix B). Although we have obviously
met this condition (or otherwise we would
have gotten imaginary solutions), coming close to the limit has clearly negatively effected the solution.
Between the 2-point fitting solution and the 3-point one,
one might want to implement a weight factor that
favors the 3-point solution at near offset and the 2-point solution at far offset.
t3eta2m
Figure 6 Same as in Figure 4, but the medium now is VTI with
 =0.2.
=0.2.

Using perturbation theory and Shanks transform (Appendix C; Bender and Orszag, 1978), we can obtain
even better 3-point fitting estimations of the stationary point solution for VTI media, much better than the
previous 2- or 3-point solutions. In fact, Figure 7 consists of two sets of curves
(corresponding to the numerical solutions and analytical ones derived using Shanks transforms) that practically overlap for all
px. The difference, given by the right curve, shows that the errors are lower than any previously obtained solutions.
t3sheta2m
Figure 7 Same as in Figure 4, but the medium now is VTI with
 =0.2. Here I am using the perturbation theory and Shank transform.

What's especially remarkable here is the high level of accuracy achieved with imaging horizontal reflectors
despite the approximations used in developing ph for such a reflector dip;
the error is almost zero for even the  =3 km/s (X/D=3)
example (see Figure 7).
The accuracy achieved here far exceeds the ones obtained
via Taylor series expansions (or even modifications of it)
of traveltime around X=0 (Alkhalifah, 1997b).
This analytical result has significant implications for
non-hyperbolic moveout inversion in VTI media.


Next: Synthetic data examples
Up: Separate-offset Prestack migration
Previous: Analytical approximations of ph
Stanford Exploration Project
11/11/1997
