![[*]](http://sepwww.stanford.edu/latex2html/foot_motif.gif)
In the following synthetic examples, I will compare migration implemented using analytical
solutions of ph with that using numerical solutions. Unless otherwise stated, all the examples
are for anisotropic media (![]() 0), hinging on the fact that what works
for anisotropic media should work for a subset of it, namely isotropic media.
0), hinging on the fact that what works
for anisotropic media should work for a subset of it, namely isotropic media.
![[*]](http://sepwww.stanford.edu/latex2html/foot_motif.gif)
 |
Figure 8 shows impulse responses of an impulse input at 1.8 s into the
prestack time migration algorithm, for a VTI medium with v=2.0 km/s
and ![]() =0.3. The offset considered here is 2.0 km.
The first response was obtained using the prestack phase-shift migration with
analytically derived values of ph (using the 3-point Shanks-transform solution).
The second response is also
obtained using prestack phase-shift migration but now with numerically derived values of ph. The
final response resulted from inputing the impulse
into an NMO correction algorithm, followed by the VTI dip-moveout (DMO) algorithm of
Alkhalifah (1996), and then a VTI post-stack phase-shift
migration. The DMO is based on the dip-decomposition method of Jakubowicz (1990).
The responses are practically identical and therefore the output of applying
these algorithms on real data should be similar.
The advantage of the phase-shift method (the numerical version) is its ability to handle
complex velocity functions.
=0.3. The offset considered here is 2.0 km.
The first response was obtained using the prestack phase-shift migration with
analytically derived values of ph (using the 3-point Shanks-transform solution).
The second response is also
obtained using prestack phase-shift migration but now with numerically derived values of ph. The
final response resulted from inputing the impulse
into an NMO correction algorithm, followed by the VTI dip-moveout (DMO) algorithm of
Alkhalifah (1996), and then a VTI post-stack phase-shift
migration. The DMO is based on the dip-decomposition method of Jakubowicz (1990).
The responses are practically identical and therefore the output of applying
these algorithms on real data should be similar.
The advantage of the phase-shift method (the numerical version) is its ability to handle
complex velocity functions.
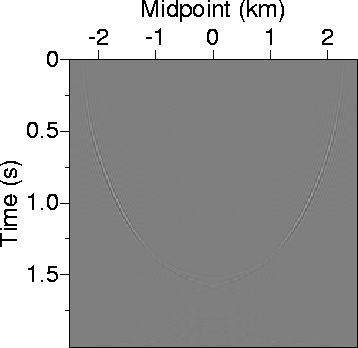 |
Figure 9 shows the difference between the numerically derived ph prestack migration response with the analytically derived one. The largest difference, as can be predicted from Figure 7, occurs at steep dips. Although kinematically the prestack and poststack approaches are similar, the DMO approach suffers from aliasing associated with improper sampling of the dip component, which appears when media with sharp velocity variations are treated. Such aliasing can somewhat be avoided by reducing the dip-decomposition sampling; however, this comes at larger cost of implementing the DMO. On the other hand, the response of the phase-shift migration does not show any of such aliasing artifacts, and the operator is thus cleaner.
 |
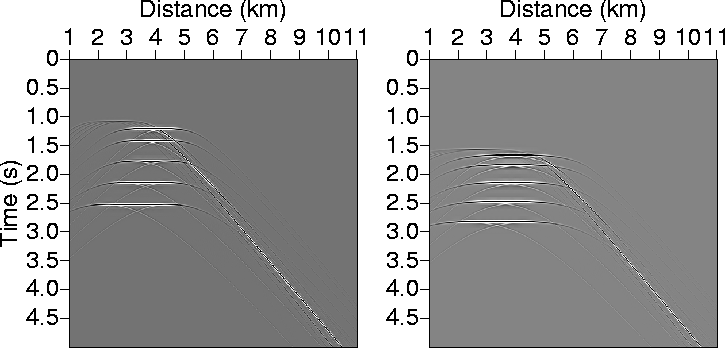 |
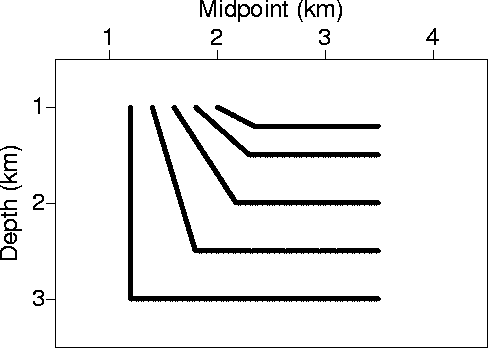
Figure 10 shows a model consisting of horizontal reflectors and dipping ones
with dip angles
ranging from 30 to 90 degrees at 15-degree intervals.
The 90-degree reflector is not imaged in a homogeneous medium
due to the limited aperture. Even the 75-degree one suffers from such a limit in the aperture.
Figure 11 shows synthetic common-offset sections generated
for a VTI medium with v=2.5 km/s and ![]() =0.3. The left section corresponds to an offset of 2 km,
the right one to an offset of 4 km. Figure 12 shows the result of
prestack migration using the
numerically derived ph.
For all practical purposes,
the migrated images are identical and accurate.
=0.3. The left section corresponds to an offset of 2 km,
the right one to an offset of 4 km. Figure 12 shows the result of
prestack migration using the
numerically derived ph.
For all practical purposes,
the migrated images are identical and accurate.
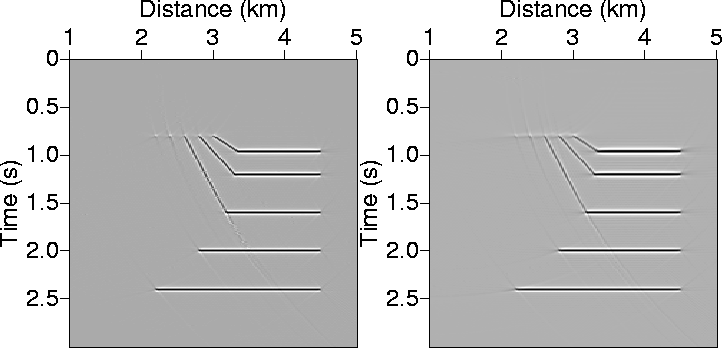 |
Figure 13 shows the migration of Figure 11 using analytically derived values of ph. Specifically, I am using the Shanks-transform 3-point solution of ph because the medium is strongly anisotropic. The imaged section resembles the one obtained using numerical solutions of ph.
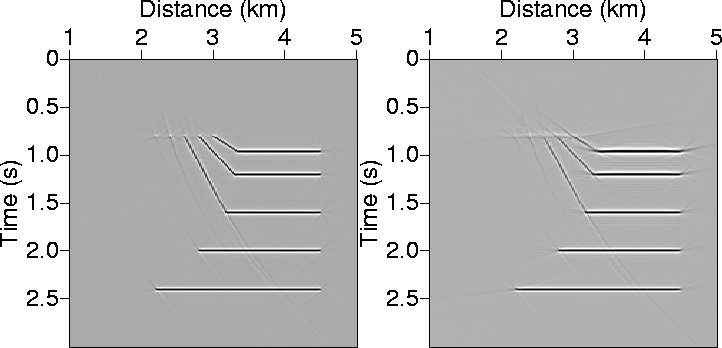 |
The artifacts notable in the 4 km offset migrated section in Figure 13 are
well within the typical mute zone, and they result from the limitations of the approximations to handle such
large offset-to-depth ratios (>3) and such a strong anisotropy (![]() =0.3).
For 4 km offset and v=2.5 km/s velocity, a typical mute time (a time where all samples
prior to it are set to zero) is about 1.5 s.
=0.3).
For 4 km offset and v=2.5 km/s velocity, a typical mute time (a time where all samples
prior to it are set to zero) is about 1.5 s.