|
vel-smooth
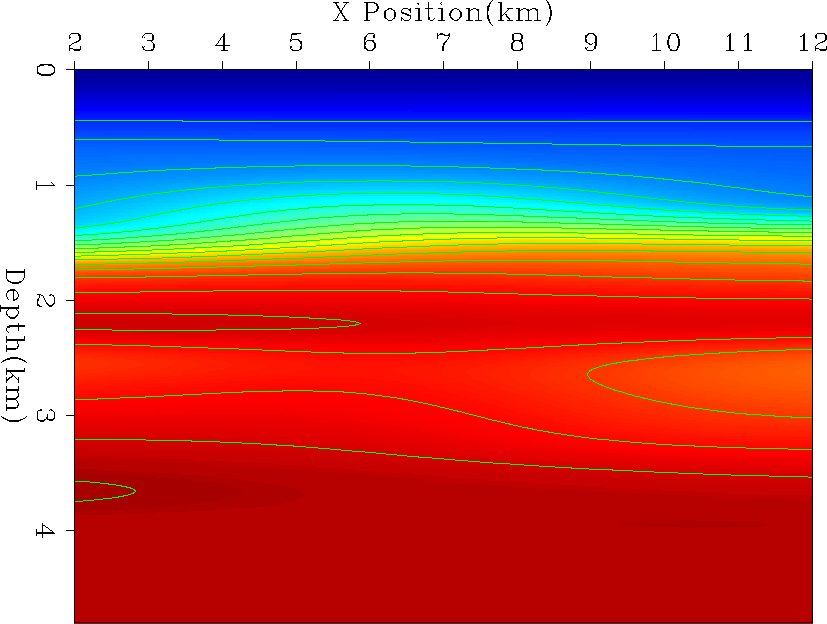
Figure 17 Initial smooth velocity. |  |
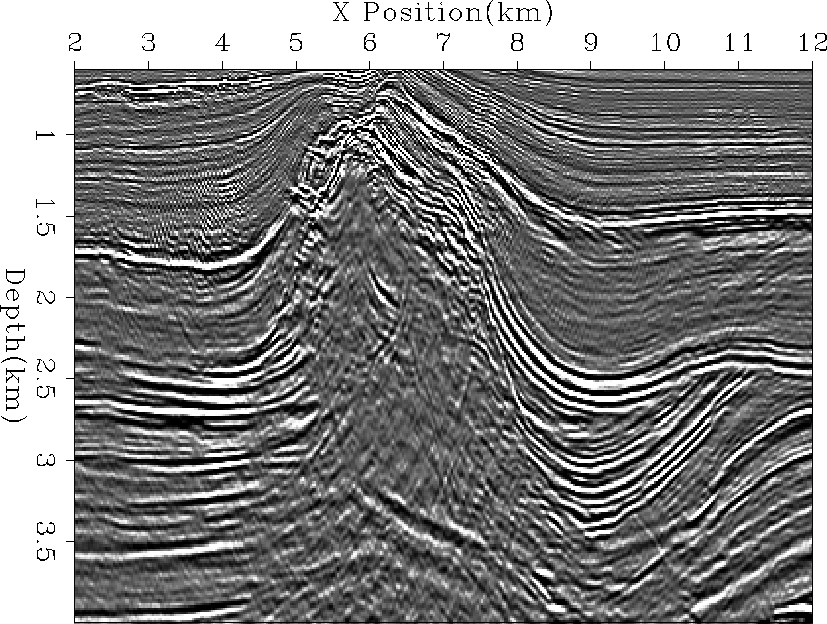
The method presented in this thesis is an attempt to combine the best features of layer and grid based tomography. In the previous section I started from a model derived using a layer-based approach. As a result the changes were not only small amplitude (because of the good starting guess) but also relatively high frequency. In this section I take a different tack. I use the same data, but start from a vastly different velocity model (Figure 17). The velocity model was constructed by first drastically smoothing the initial model used in the previous section (Figure 2). I then migrated with this velocity, picked the salt boundaries, and added in the salt structure. Using this velocity model I then remigrated the data (Figure 18). The top of the salt is extremely messy and the bottom of the salt is not flat and low in amplitude. We see little below the fault at x=10 km and little of the reflections below the salt edge.
|
vel-smooth
Figure 17 Initial smooth velocity. |  |
 |
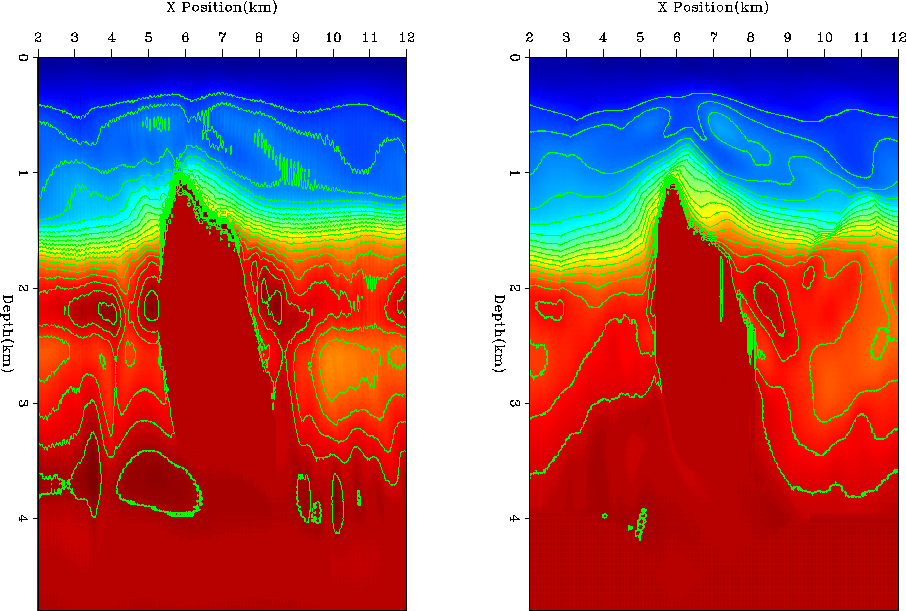
A more complete test would be to start from this model and try a layer-based approach, a standard grid-based approach, and a tau-steering approach. Figure 2 and Figure 3 to some measure represent the best velocity and migrated image possible using a layer-based approach. If I do three non-linear iterations of the remaining two approaches I get the velocities in Figure 19. The left panel shows the result of using depth and a Laplacian smoother. Note how the velocity does not follow structure. We do not see the chalk layer bend around the top of the salt and we do not see the valley shape along the right edge of the salt. In the tau-steering approach both of these features are apparent.
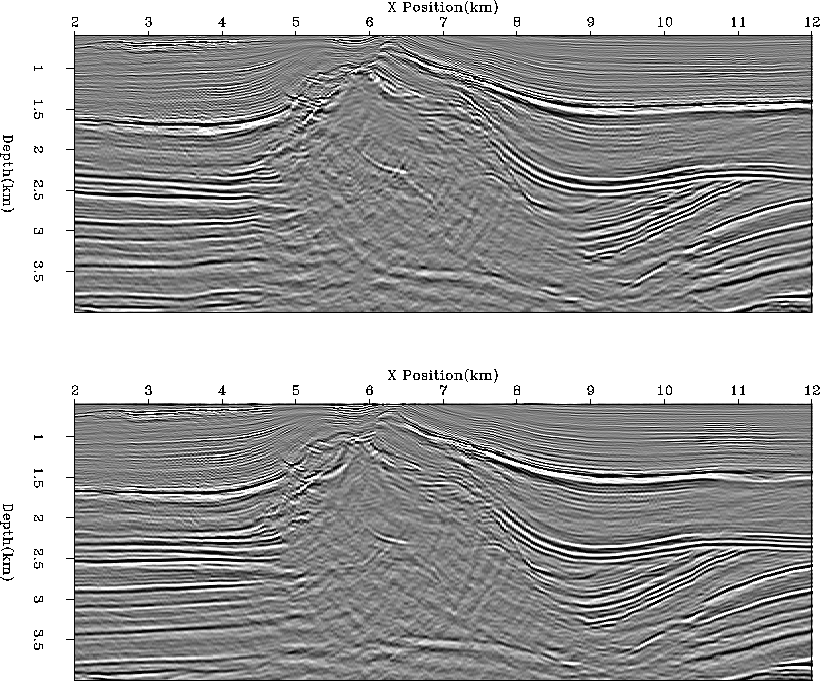
Figure 20 shows the result migrating with each velocity. Image quality has definitely improved in both cases over the initial migrated image (Figure 18), but the tau-steering result is significantly better. The salt top is much cleaner in the tau-steering image than either the grid or layer based results. We are seeing more structure to the right of the salt and a better salt bottom reflection. In addition the reflectors under the salt edge are much clearer.
 |
![[*]](http://sepwww.stanford.edu/latex2html/movie.gif)
 |
![[*]](http://sepwww.stanford.edu/latex2html/movie.gif)