Next: Starting from a smooth
Up: 2-D field tests
Previous: First iteration
If we perform another iteration of tomography we see further improvement.
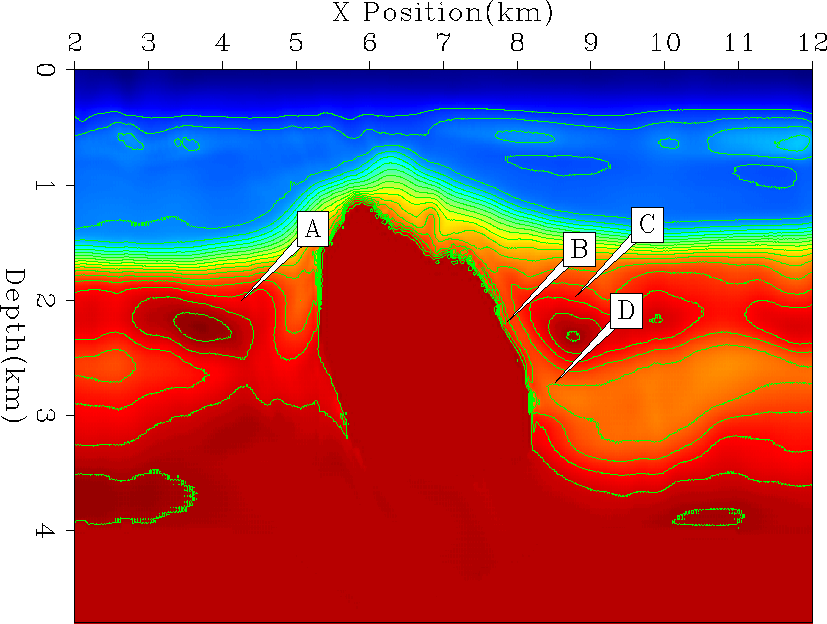
Figure 12 shows the velocity model.
The velocity has been further increased in the
the chalk layer on both sides of the salt (`A' and `B').
On the right side we also see a break in the high
velocity zone developing (`C').
In the Liassic
where the chalk velocity was increased in the first
iteration it has been decreased by the second iteration, especially
on the right side of the salt dome (`D').
This decrease continues all the way to the salt edge.
vel-final
Figure 12 Final velocity.
The velocity has been further increased in the
chalk layer on both sides of the salt (`A' and `B').
On the right side we also see a break in the high
velocity zone developing (`C').
In the Liassic
where the chalk velocity was increased in the first
iteration it has been decreased by the second iteration, especially
on the right side of the salt dome (`D').
This decrease continues all the way to the salt edge.
|
|  |
![[*]](http://sepwww.stanford.edu/latex2html/movie.gif)


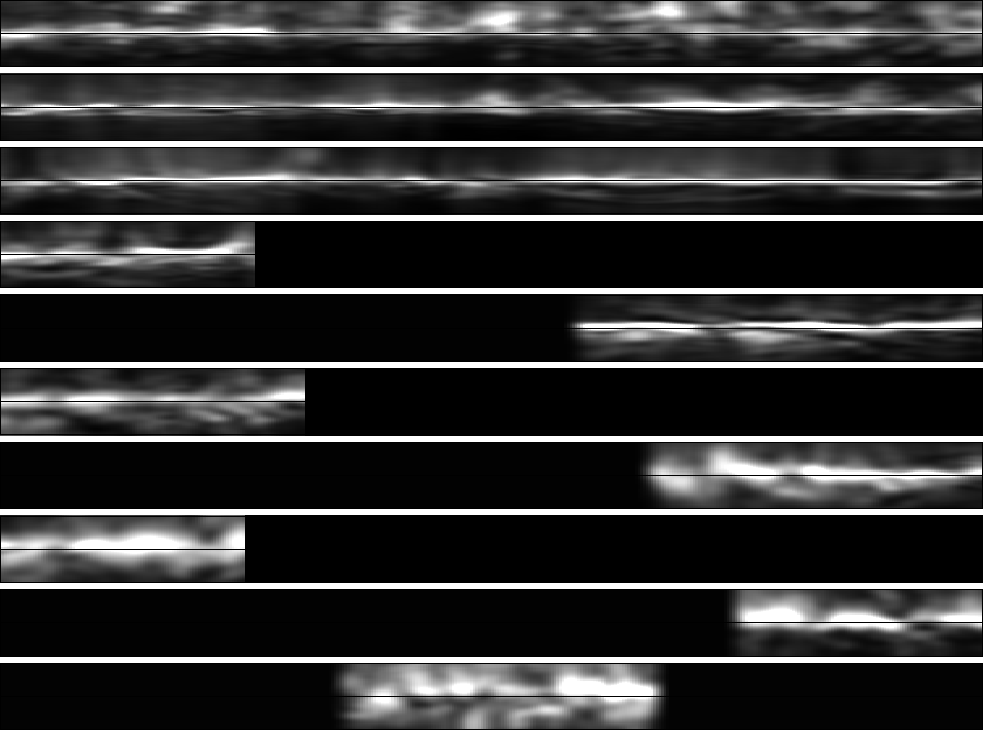
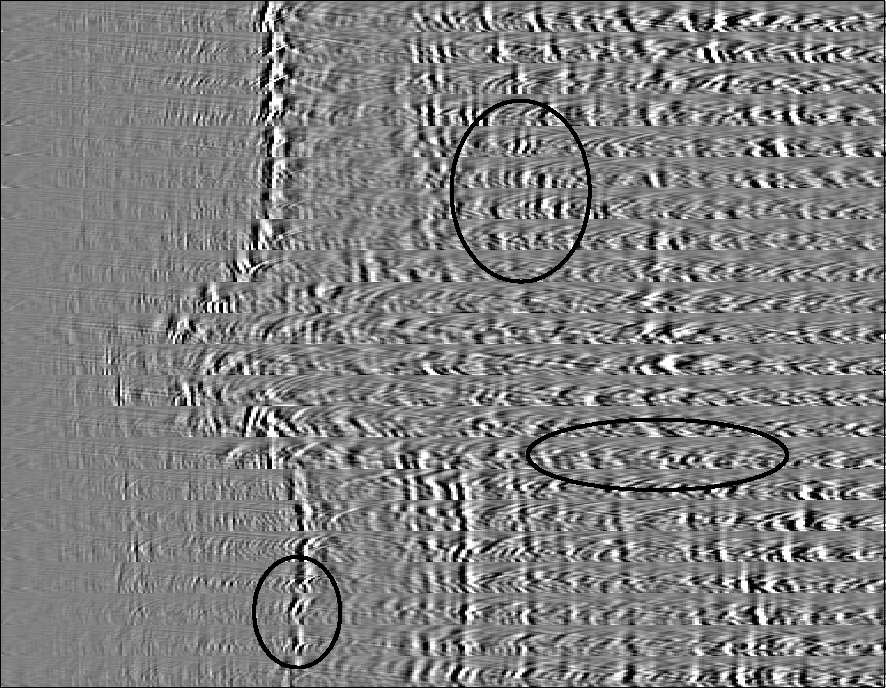
The CRP gathers (Figure 14) are generally flatter
and more coherent. The semblance along the reflectors
(Figure 13) is more continuous and closer to zero curvature.
elf-sem-ref.vel.best.steer
Figure 13 Semblance panels from
ten of the reflectors used in tomography.
moveout-vel.best.steer
Figure 14 CRP gathers after the second iteration of tomography.
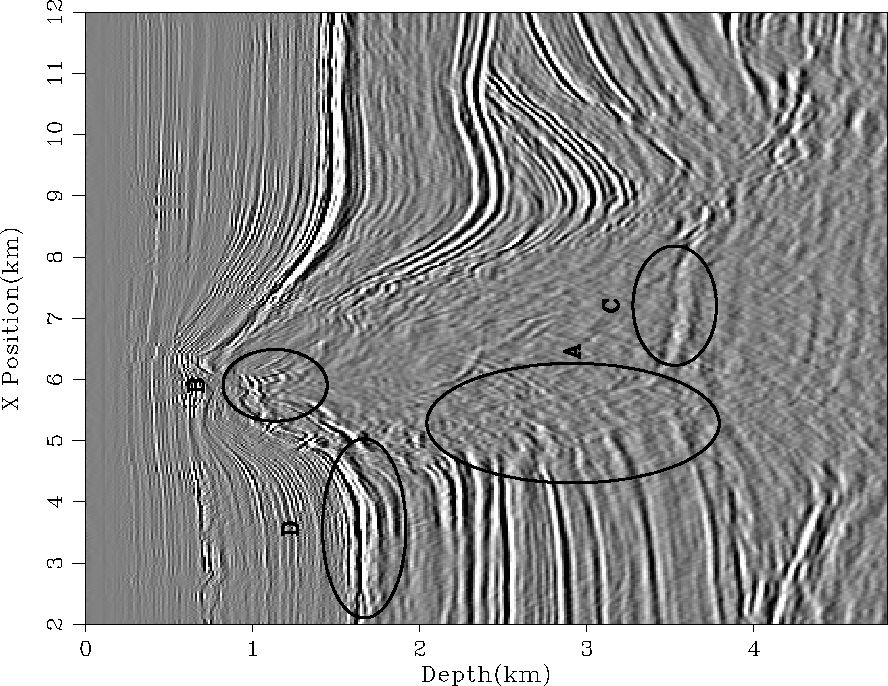
The migration (Figure 15) using the new
velocity (Figure 12) has also improved.
The chalk layer boundary (`D') is sharper. The top of salt has fewer
artifacts (`B') and the bottom of salt is more continuous (`C').
The upper reflectors on the left side of the image
are more continuous. The greatest improvement is seen below
the salt edge (`A'). The reflectors are more continuous
and of consistent amplitude.
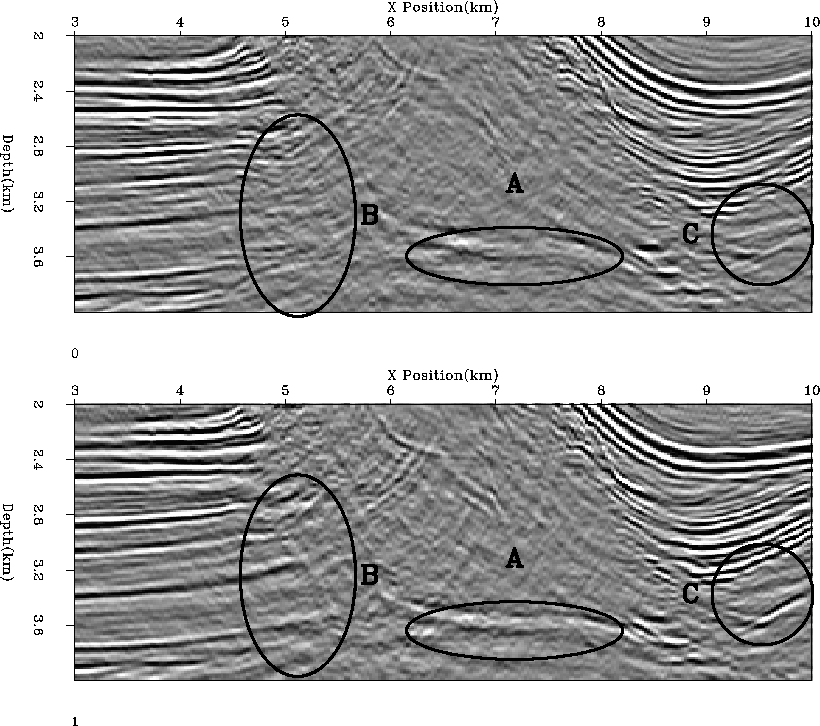
If we look at the lower portion of the image in more detail,
Figure 16, the differences
become even more obvious. The salt reflector is flatter and
continuous (`A'). The reflections to the right of the salt (`C')
body are of higher frequency and we are beginning see some structure
that was not obvious in the initial migration. Below the salt
edge (`B') we see dramatic improvement. In the initial migration,
reflector continuity was lost under the salt edge. In the final
migrated image we are able to continue the reflectors much further.
mig-final
Figure 15 Final migrated image. Locations A-D show
improvement compared to Figure 3.
bot.compare
Figure 16 Result of migrating with
the initial velocity, top panel, and the final velocity, bottom panel.
We
see a more coherent and believable bottom salt reflection (`A').
The reflectors bounding the salt on the left are more continuous (`B')
and of higher frequency (`C').
Next: Starting from a smooth
Up: 2-D field tests
Previous: First iteration
Stanford Exploration Project
4/29/2001