

Next: Pictures at last!
Up: WSM manipulation: Artman, 2001
Previous: Data Distribution
Unfortunately, as magnitudes for these horizontal stresses are often
not available due to the difficulty of the measurement, a valuable
check on the observed relationships to come have not been made. That
is not to say such data is completely unavailable: (4)
propose a method to estimate this quantity from
earthquake focal mechanisms, and (2) explain its measurement
from inducing borehole hydraulic fractures. The
suggestion then for this next level of investigation would be to
compare the contour plots of stress magnitude with those generated
from this methodology.
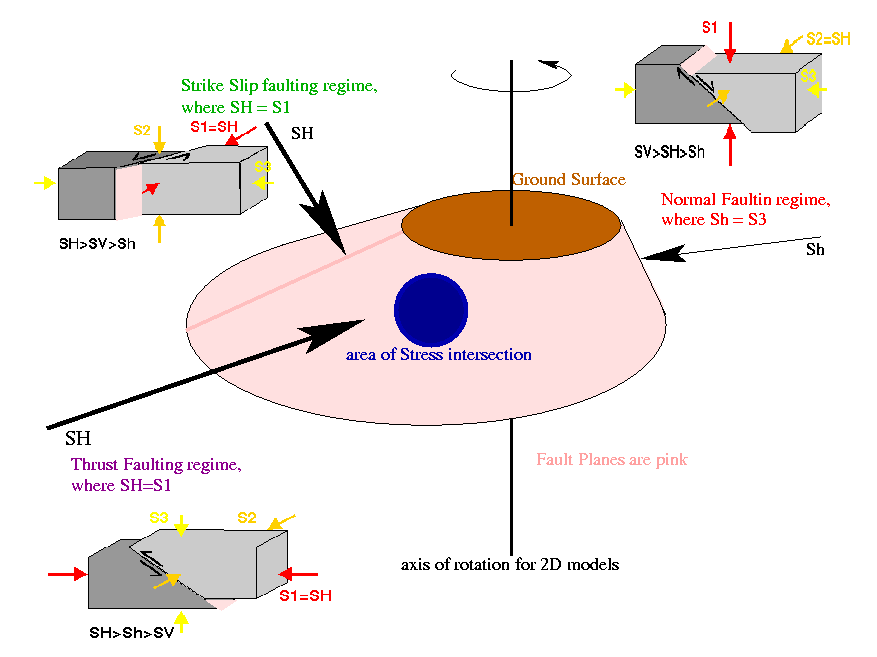
To address the question posed earlier of whether the combination of
various stress regimes is a legitimate logical step, I have prepared
the below figure illustrating a confluence of stress directions that
intersect in a region. These ideas are in Figure 4.
Careful study of caption and cartoon should clarify the concept. By
thus considering the Sh azimuth on the normal faulting regime, I
believe it is plausible to map using all faulting regime data as
input.
As to the meaning of the concentrations of force shown in the maps,
there are three interpretations that seem plausible. The first, and
least exciting, is that these patterns are merely a function of the
uneven distribution of data. This is suggested distinctly by the thrust regime
data from the Pacific plate map, and is the reason why all maps are
produced with the data points used in their calculation are included
on the one of the outputs. I beleive investigation of this
interpretation could be made by making smaller area maps utilizing
small subsets of the data.
The physical explanations that are left I refer to as the Force or
Focus question and are the final two options I have considered.
Basal drag on mountain roots in continental crust by
mantle convection could be a source of intraplate stress fields. The
concentration of stress azimuth intersections shown by the maps could
indicate the location of crustal deformation due to such local
accelaration.
Alternatively, the focus idea would be related to a ridge-push
argument for intraplate stress fields. If an arcuate force source
applies force evenly along its length, then it is easy to imagine a
focusing of force as if a parabolic reflector of EM energy. In this
scenario, the locations highlighted by the stress maps could indicate
sites of potential secondary geologic phenomena such as volcanism,
compression, or even tight interlocked stability.
regime
Figure 4 By rotating each of the
simple block model faulting styles around an axis somewhere to the
left of the block diagrams, it is possible to produce toroids of fault
planes that will have conical expression in three dimensions. With a
small step in logic, one can then arrive at the above earth model.
This idea is scale independent and does not mandate the presence of
the faults. ("Pink" fault planes have turned light gray through the
file conversion process)


Next: Pictures at last!
Up: WSM manipulation: Artman, 2001
Previous: Data Distribution
Stanford Exploration Project
3/24/2001

![]()