


Next: Code Appendix
Up: WSM manipulation: Artman, 2001
Previous: Searching for Real Meaning
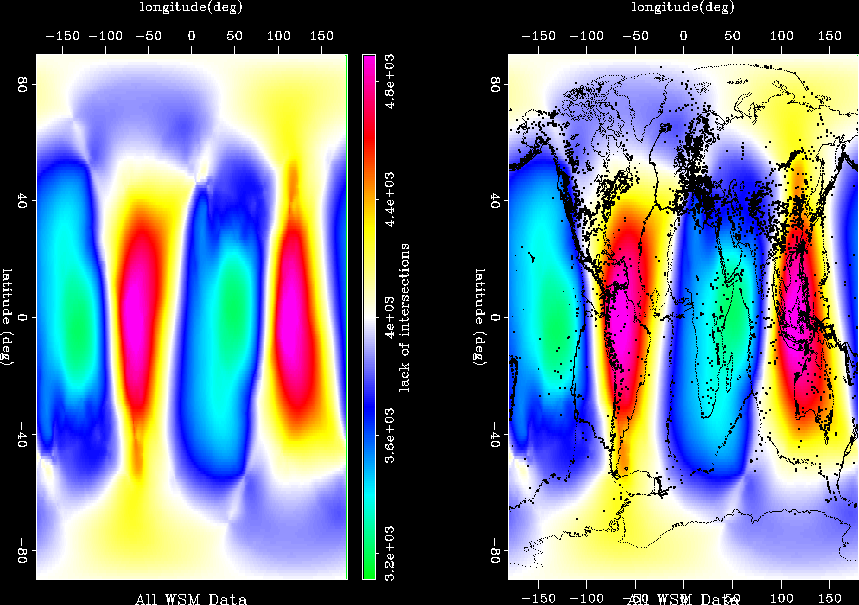
plot_0
Figure 5 All WSM data (shown at dots)
considered.
![[*]](http://sepwww.stanford.edu/latex2html/movie.gif)


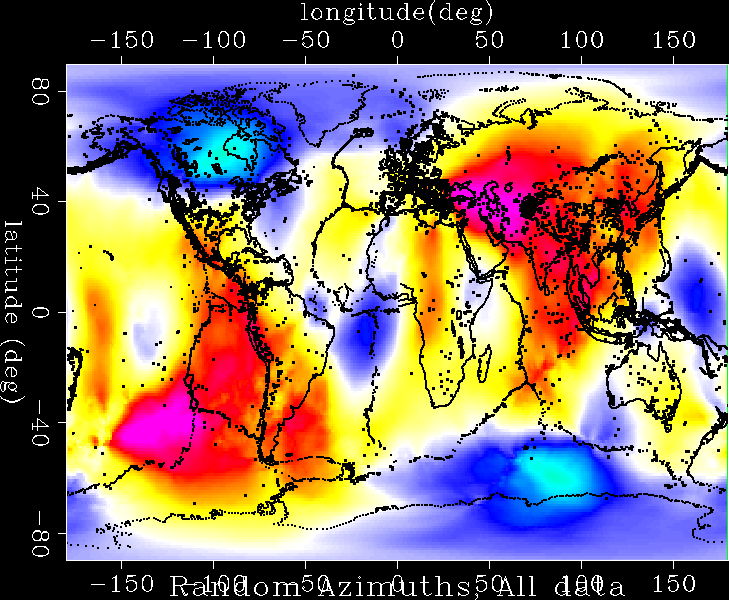
 plot_rand_0
Figure 6 Random azimuths
replacing real azimuth data.
![[*]](http://sepwww.stanford.edu/latex2html/movie.gif)


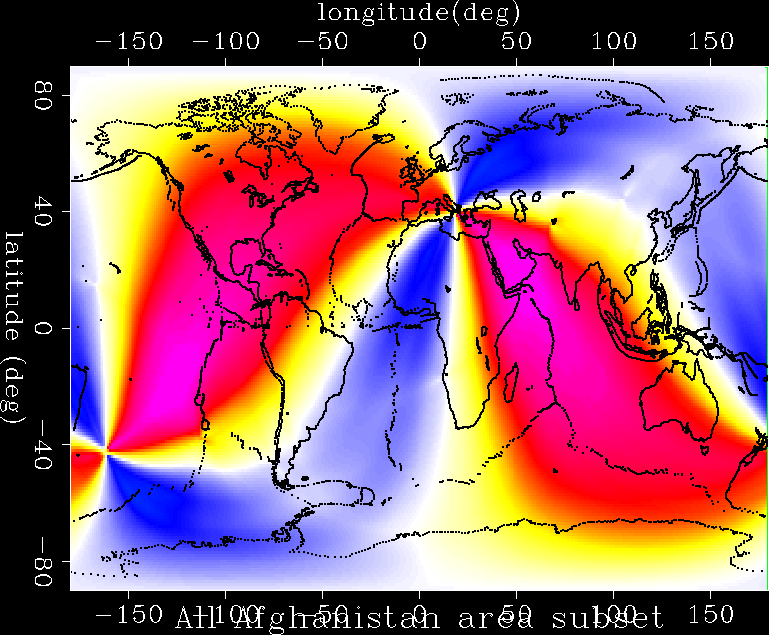
 plot_af
Figure 7 First 100 data points in database
![[*]](http://sepwww.stanford.edu/latex2html/movie.gif)


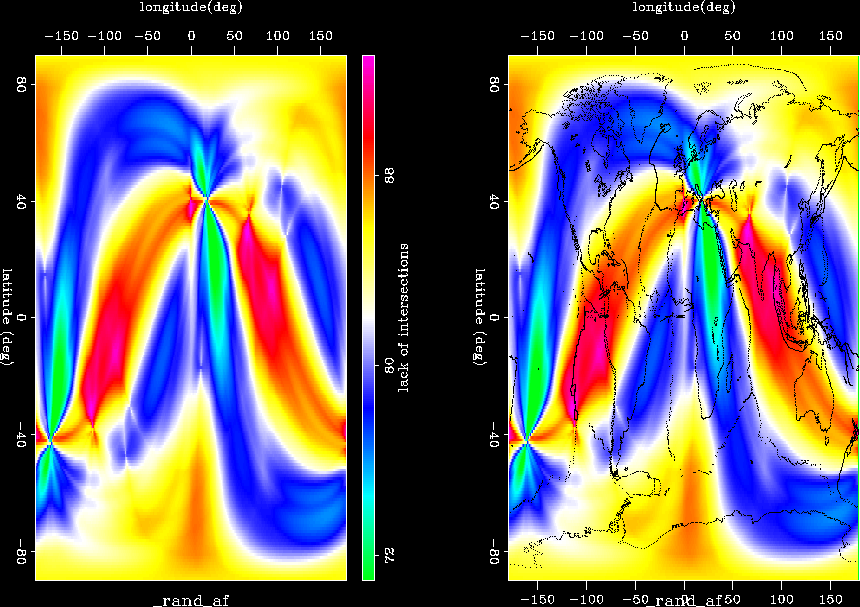
 plot_rand_af
Figure 8 Neat patterns from
random azimuths.
![[*]](http://sepwww.stanford.edu/latex2html/movie.gif)


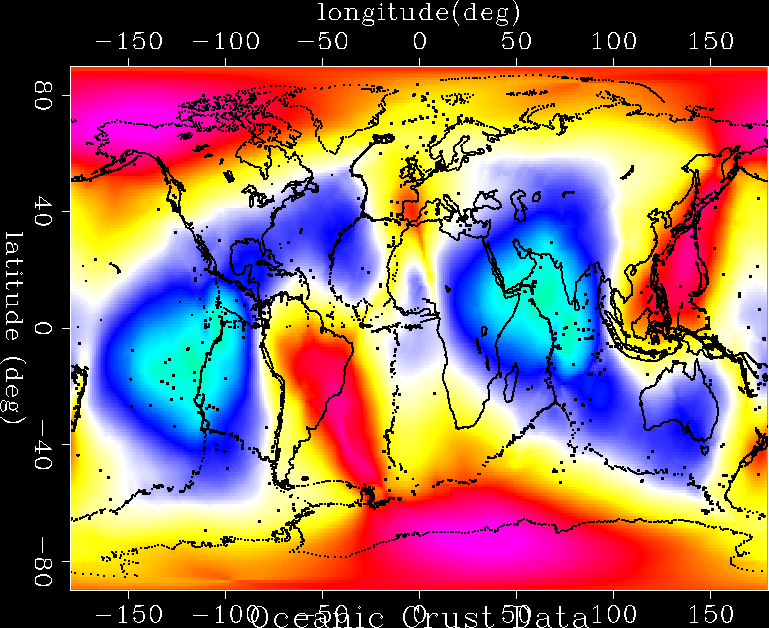
 plot_ocean
Figure 9 Only oceanic crust data.
![[*]](http://sepwww.stanford.edu/latex2html/movie.gif)


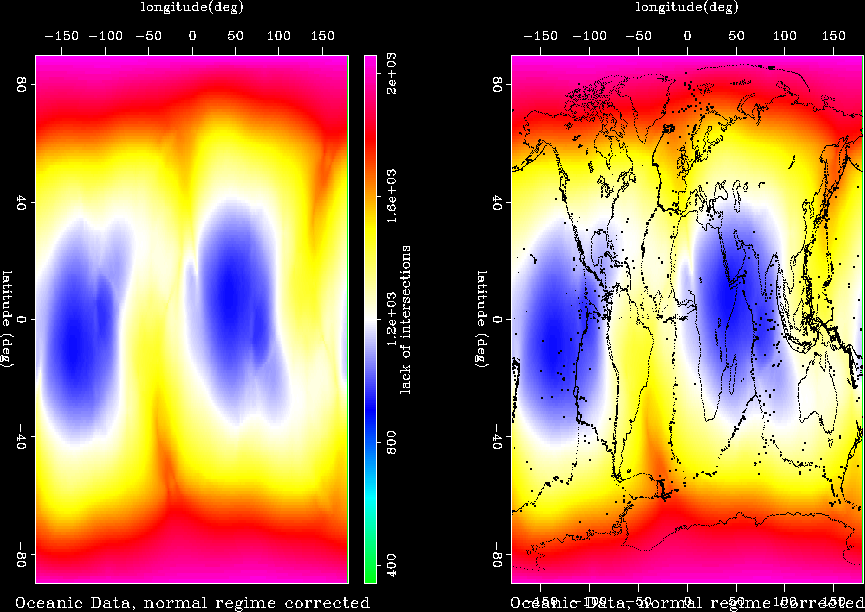
 plot_nocean
Figure 10 Oceanic data with
normal-90o correction.
![[*]](http://sepwww.stanford.edu/latex2html/movie.gif)


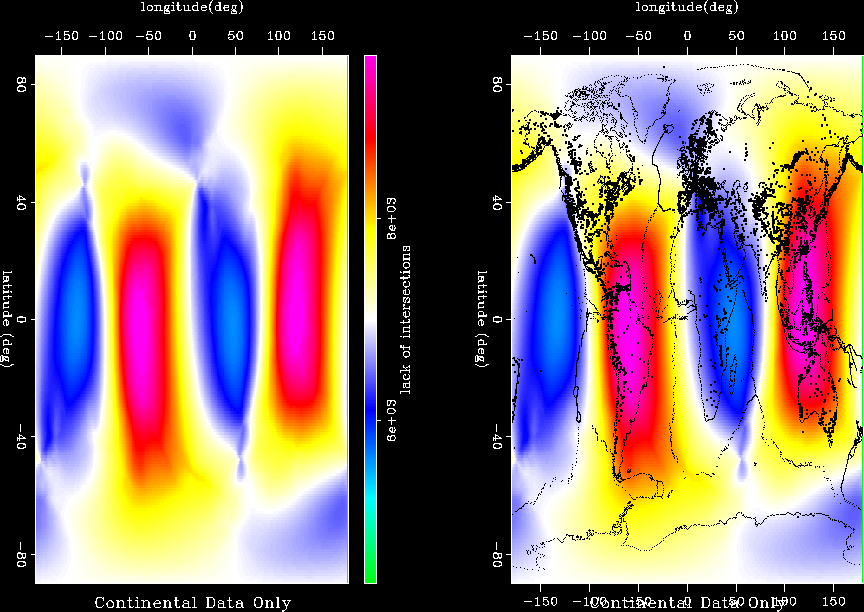
 plot_cont
Figure 11 All data on continental crust.
![[*]](http://sepwww.stanford.edu/latex2html/movie.gif)


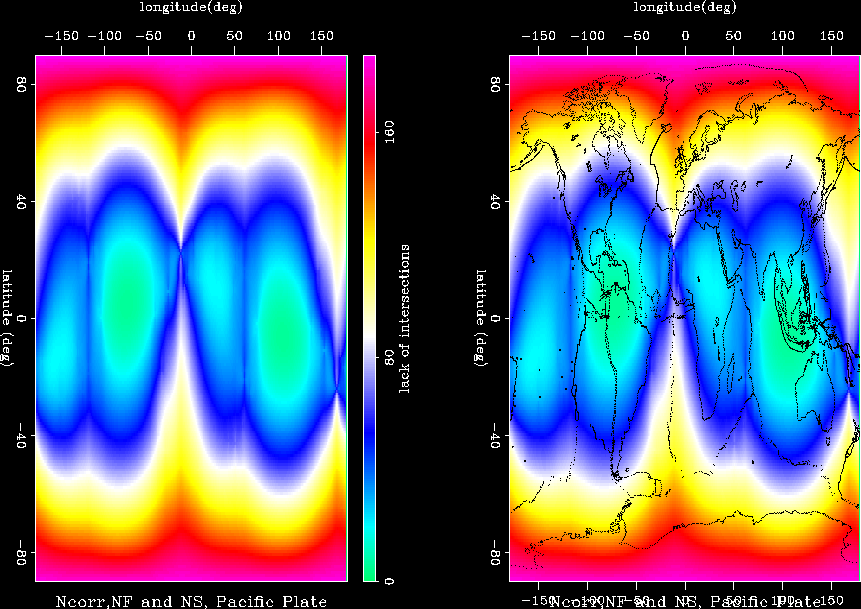
 plot_nNFSpacific
Figure 12 Normal and NS regime (Sh) data on pacific plate.
![[*]](http://sepwww.stanford.edu/latex2html/movie.gif)


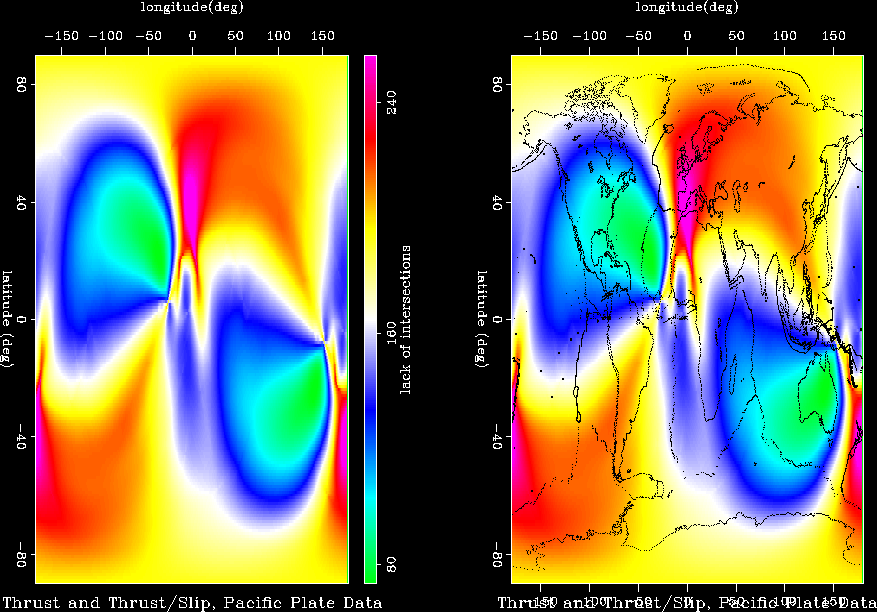
 plot_TFSpacific
Figure 13 Thrust and TS regime data on pacific plate.
![[*]](http://sepwww.stanford.edu/latex2html/movie.gif)


Next: Code Appendix
Up: WSM manipulation: Artman, 2001
Previous: Searching for Real Meaning
Stanford Exploration Project
3/24/2001
![[*]](http://sepwww.stanford.edu/latex2html/movie.gif)

![[*]](http://sepwww.stanford.edu/latex2html/movie.gif)
![[*]](http://sepwww.stanford.edu/latex2html/movie.gif)
![[*]](http://sepwww.stanford.edu/latex2html/movie.gif)
![[*]](http://sepwww.stanford.edu/latex2html/movie.gif)
![[*]](http://sepwww.stanford.edu/latex2html/movie.gif)
![[*]](http://sepwww.stanford.edu/latex2html/movie.gif)
![[*]](http://sepwww.stanford.edu/latex2html/movie.gif)
![[*]](http://sepwww.stanford.edu/latex2html/movie.gif)
![[*]](http://sepwww.stanford.edu/latex2html/movie.gif)