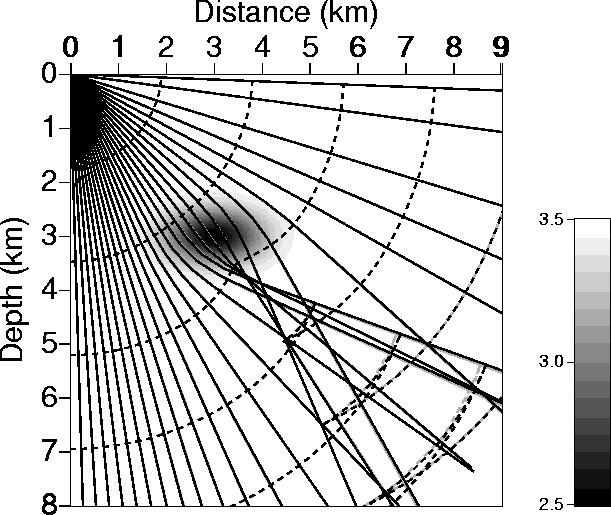
The presence of a lens anomaly in a velocity model results in a variety of ray paths,
the most interesting of which
is a development of a triplication in the wavefront. This multi-arrival traveltime phenomenon
typically occurs when a negative
velocity anomaly is present. The intriguing issue is that triplication can also occur
when we have positive ![]() anomalies.
anomalies.
Figure 5 shows rays and corresponding wavefronts that were obtained
using conventional raytracing in the depth domain (black curves), and using the equivalent raytracing
in the ![]() -domain (gray curves)
through a VTI model with
-domain (gray curves)
through a VTI model with ![]() =0.1. The
velocity model is shown in the background with a negative velocity anomaly that has a
peak of -1.0 km/s. The result
is a noticeable triplication that develops soon after the rays pass the anomaly.
Despite the triplication, the results of raytracing in the two domains (depth and time) are similar.
=0.1. The
velocity model is shown in the background with a negative velocity anomaly that has a
peak of -1.0 km/s. The result
is a noticeable triplication that develops soon after the rays pass the anomaly.
Despite the triplication, the results of raytracing in the two domains (depth and time) are similar.
 |
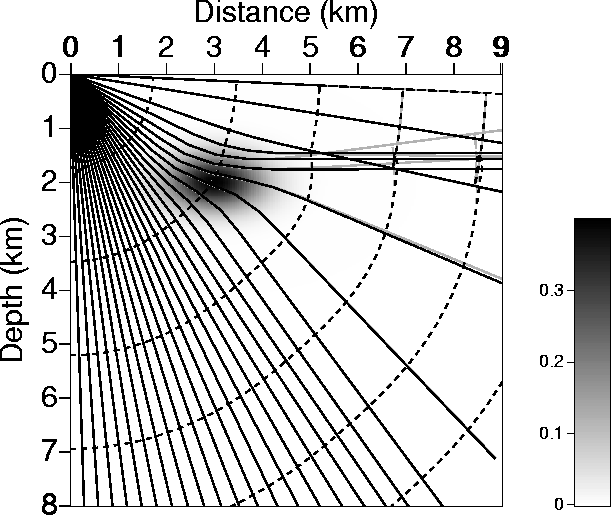
Figure 6 also shows raypaths through an anomaly.
The anomaly now is in ![]() , and it
is positive. Therefore, the background is an
, and it
is positive. Therefore, the background is an ![]() model, with
model, with ![]() =0 everywhere other
than in the anomaly.
Again, the black curves correspond to solutions of raytracing in the depth domain,
while the gray curves
correspond to raytracing in the
=0 everywhere other
than in the anomaly.
Again, the black curves correspond to solutions of raytracing in the depth domain,
while the gray curves
correspond to raytracing in the ![]() -domain. Triplication,
smaller than that associated with the velocity
perturbation, occurs in the wavefront. Velocity-wise this
medium is homogeneous; it is
-domain. Triplication,
smaller than that associated with the velocity
perturbation, occurs in the wavefront. Velocity-wise this
medium is homogeneous; it is ![]() that is
causing the severe bending of the rays! The rays with larger
propagation angles from the vertical are the most influenced
by the
that is
causing the severe bending of the rays! The rays with larger
propagation angles from the vertical are the most influenced
by the ![]() anomaly.
anomaly.
 |