Using the ray-tracing system of equations derived earlier, we can compute traveltimes numerically. Unlike numerical solutions of the eikonal equation, raytracing provides multi-arrival traveltimes and amplitudes. We want to confirm numerically the following two aspects of implementing raytracing in the new coordinate system:
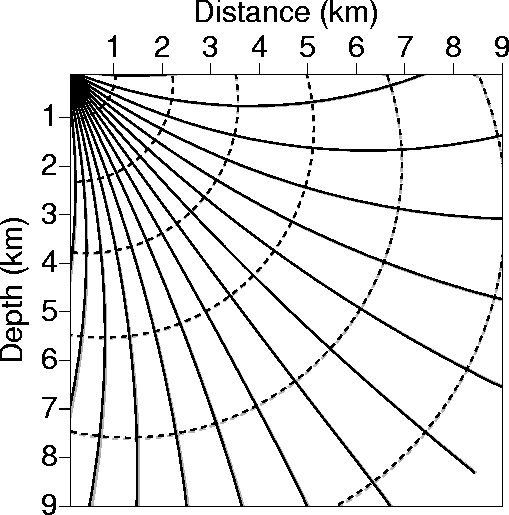
Figure 1 shows sixteen rays originating from a source
on the surface at position x=0
through the same depth velocity model of vv(x,z)=1.5+0.225 z+0.15 x,
v(x,z)=2.0+0.3 z+0.2 x, and ![]() using conventional raytracing in the depth domain
(black curves), and the new raytracing in the
using conventional raytracing in the depth domain
(black curves), and the new raytracing in the ![]() -domain (gray curve). We achieved the
-domain (gray curve). We achieved the ![]() -domain ray
tracing results by mapping the depth velocity model to time using equation (3),
and then mapping the ray solutions back to depth using equation (30).
The sixteen rays have ray parameters
ranging from zero to the maximum value of 1/Vh (Vh is the horizontal velocity),
with a fixed ray-parameter spacing of 1/(15 Vh). The rays terminate at the
same time of 8 s, and the wavefronts (given by the dashed curves) are plotted at about 1.6-s intervals.
The wavefronts that correspond to the different raytracings are virtually coincident, a result that
agrees with our analytical findings.
-domain ray
tracing results by mapping the depth velocity model to time using equation (3),
and then mapping the ray solutions back to depth using equation (30).
The sixteen rays have ray parameters
ranging from zero to the maximum value of 1/Vh (Vh is the horizontal velocity),
with a fixed ray-parameter spacing of 1/(15 Vh). The rays terminate at the
same time of 8 s, and the wavefronts (given by the dashed curves) are plotted at about 1.6-s intervals.
The wavefronts that correspond to the different raytracings are virtually coincident, a result that
agrees with our analytical findings.
 |
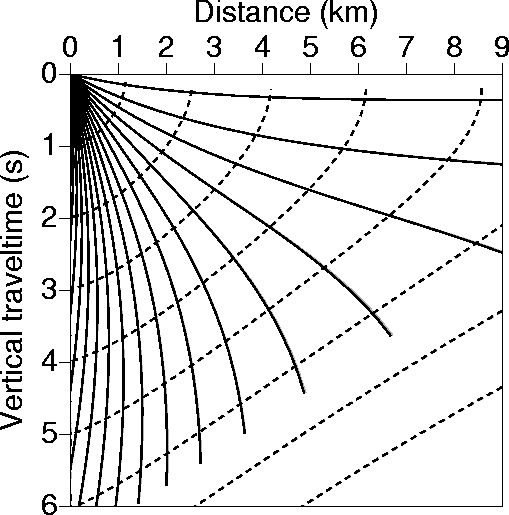
In Figure 2, we check for another aspect of the theory,
that is, the independence of raytracing from the vertical velocity
for laterally factorized VTI media. Again, sixteen rays were ray traced through a VTI model with
v(x,z)=2+0.2 x km/s, and ![]() . The raytracing was done in the
. The raytracing was done in the
![]() -domain coordinates, and, as a result, the rays and corresponding wavefronts appear in
the
-domain coordinates, and, as a result, the rays and corresponding wavefronts appear in
the ![]() -domain. The vertical velocity varies considerably
between the two sets of curves (black and gray),
and yet the two curves coincide exactly. That is because in both models
-domain. The vertical velocity varies considerably
between the two sets of curves (black and gray),
and yet the two curves coincide exactly. That is because in both models ![]() , which is
the ratio of the vertical to NMO P-wave velocity, does not vary laterally--
a condition for the independence of raytracing from vertical velocity in the
, which is
the ratio of the vertical to NMO P-wave velocity, does not vary laterally--
a condition for the independence of raytracing from vertical velocity in the ![]() -domain.
Therefore, under this condition, raytracing
is dependent on only v and
-domain.
Therefore, under this condition, raytracing
is dependent on only v and ![]() .
.
 |
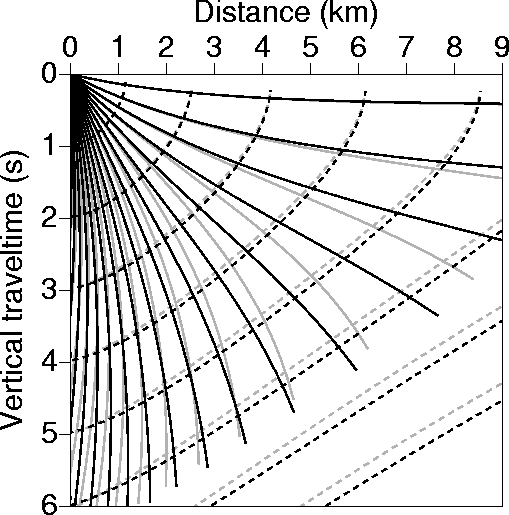
However,
when ![]() varies laterally, raytracing does depend on the vertical velocity.
The amount of its dependence is controlled by the size of the
lateral variation in
varies laterally, raytracing does depend on the vertical velocity.
The amount of its dependence is controlled by the size of the
lateral variation in ![]() . Figure 3 shows rays penetrating in the same model
as Figure 2, but with the gray curves corresponding to a laterally varying
. Figure 3 shows rays penetrating in the same model
as Figure 2, but with the gray curves corresponding to a laterally varying ![]() that satisfies
that satisfies
![]()
 |
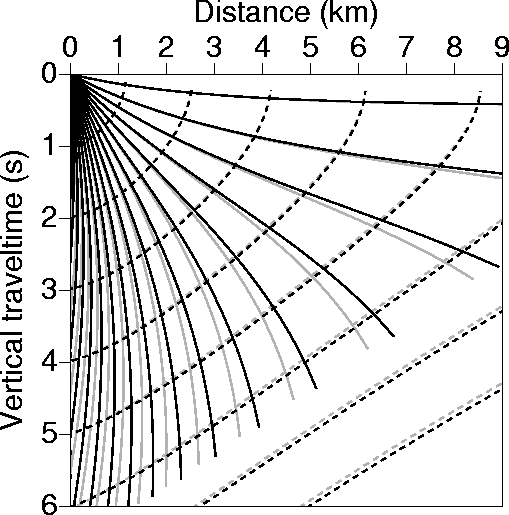
Considering that ![]() , the parameter that relates the vertical and NMO velocity, ranges typically
between -0.1 and 0.4
, the parameter that relates the vertical and NMO velocity, ranges typically
between -0.1 and 0.4 ![[*]](http://sepwww.stanford.edu/latex2html/foot_motif.gif) ,
Figure 4
shows a more practical
,
Figure 4
shows a more practical ![]() variation, in which the curves given by the two models are
extremely close.
variation, in which the curves given by the two models are
extremely close.
 |
The slightness of the variation suggests that for practical applications
of the ![]() -domain coordinate processing, we can simply
ignore the vertical velocity, and rely on the NMO velocity and
-domain coordinate processing, we can simply
ignore the vertical velocity, and rely on the NMO velocity and ![]() .
.