

Next: Packing both missing data
Up: MISSING DATA AND UNKNOWN
Previous: MISSING DATA AND UNKNOWN
In any data interpolation or extrapolation,
we want the extended data to behave like the original data.
And, in regions where there is no observed data,
the extrapolated data should drop away in a fashion
consistent with its spectrum determined from the known region.
We will see that a filter like (a-2, a-1, 1, a1, a2)
fails to do the job.
We need to keep an end value constrained to ``1,''
not the middle value.
In chapter ![[*]](http://sepwww.stanford.edu/latex2html/cross_ref_motif.gif) we learned about the interpolation-error filter
(IE filter),
a filter constrained to be ``+1'' near the middle
and consisting of other coefficients chosen to minimize the power out.
The basic fact about the IE filter is that the spectrum out
tends to the inverse of the spectrum in,
so the spectrum of the IE filter tends to the inverse squared
of the spectrum in.
The IE filter is thus not a good weighting function for a minimization,
compared to the prediction-error (PE) filter,
whose spectrum is inverse to the input.
To confirm these concepts,
I prepared synthetic data consisting of a fragment of a damped exponential,
and off to one side of it an impulse function.
Most of the energy is in the damped exponential.
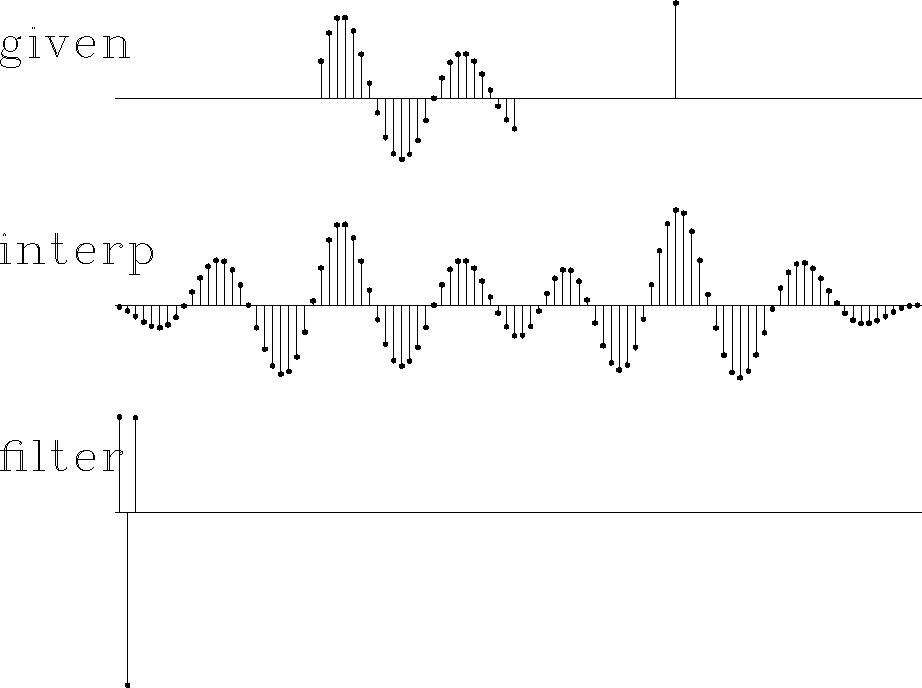
Figure 10 shows that the spectrum and the extended data
are about what we would expect.
From the extrapolated data,
it is impossible to see where the given data ends.
we learned about the interpolation-error filter
(IE filter),
a filter constrained to be ``+1'' near the middle
and consisting of other coefficients chosen to minimize the power out.
The basic fact about the IE filter is that the spectrum out
tends to the inverse of the spectrum in,
so the spectrum of the IE filter tends to the inverse squared
of the spectrum in.
The IE filter is thus not a good weighting function for a minimization,
compared to the prediction-error (PE) filter,
whose spectrum is inverse to the input.
To confirm these concepts,
I prepared synthetic data consisting of a fragment of a damped exponential,
and off to one side of it an impulse function.
Most of the energy is in the damped exponential.
Figure 10 shows that the spectrum and the extended data
are about what we would expect.
From the extrapolated data,
it is impossible to see where the given data ends.
exp
Figure 10
Top is synthetic data with missing data represented by zeros.
Middle includes the interpolated values.
Bottom is the filter,
a prediction-error filter
which may look symmetric but is not quite.
|
|  |


For comparison, I prepared
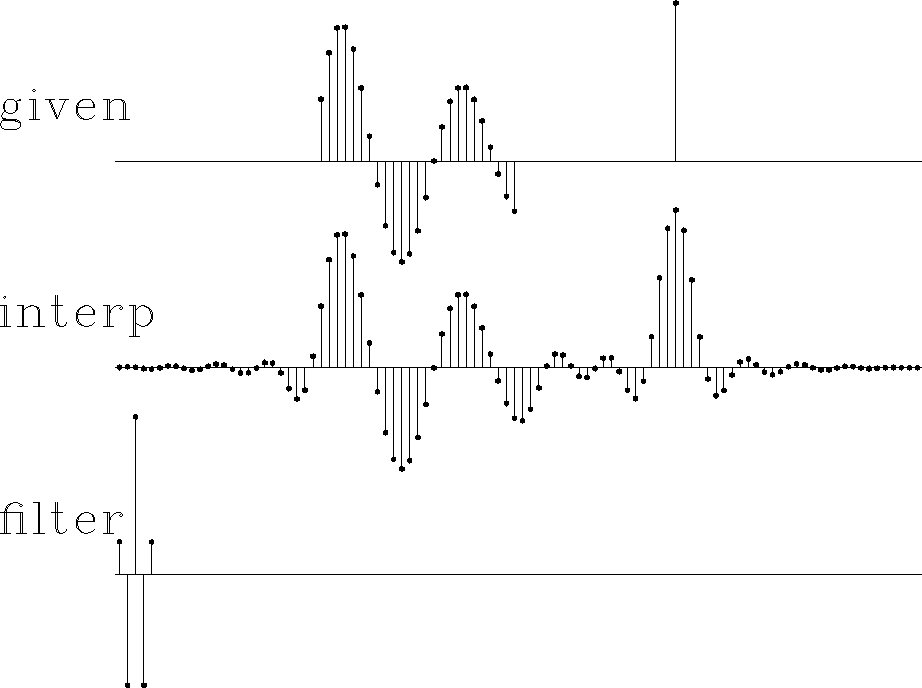
Figure 11.
It is the same as
Figure 10,
except that the filter is constrained in the middle.
Notice that the extended data does not have the spectrum
of the given data--the wavelength is much shorter.
The boundary between real data and extended data
is not nearly as well hidden as in
Figure 10.
center
Figure 11
Top is synthetic data with missing data represented by zeros.
Middle includes the interpolated values.
Bottom is the filter,
an interpolation-error filter.
|
|  |


Next I will pursue some esoteric aspects of one-dimensional
missing-data problems.
You might prefer to jump forward
to section ![[*]](http://sepwww.stanford.edu/latex2html/cross_ref_motif.gif) ,
where we tackle two-dimensional analysis.
,
where we tackle two-dimensional analysis.


Next: Packing both missing data
Up: MISSING DATA AND UNKNOWN
Previous: MISSING DATA AND UNKNOWN
Stanford Exploration Project
10/21/1998
![[*]](http://sepwww.stanford.edu/latex2html/cross_ref_motif.gif) we learned about the interpolation-error filter
(IE filter),
a filter constrained to be ``+1'' near the middle
and consisting of other coefficients chosen to minimize the power out.
The basic fact about the IE filter is that the spectrum out
tends to the inverse of the spectrum in,
so the spectrum of the IE filter tends to the inverse squared
of the spectrum in.
The IE filter is thus not a good weighting function for a minimization,
compared to the prediction-error (PE) filter,
whose spectrum is inverse to the input.
To confirm these concepts,
I prepared synthetic data consisting of a fragment of a damped exponential,
and off to one side of it an impulse function.
Most of the energy is in the damped exponential.
Figure 10 shows that the spectrum and the extended data
are about what we would expect.
From the extrapolated data,
it is impossible to see where the given data ends.
we learned about the interpolation-error filter
(IE filter),
a filter constrained to be ``+1'' near the middle
and consisting of other coefficients chosen to minimize the power out.
The basic fact about the IE filter is that the spectrum out
tends to the inverse of the spectrum in,
so the spectrum of the IE filter tends to the inverse squared
of the spectrum in.
The IE filter is thus not a good weighting function for a minimization,
compared to the prediction-error (PE) filter,
whose spectrum is inverse to the input.
To confirm these concepts,
I prepared synthetic data consisting of a fragment of a damped exponential,
and off to one side of it an impulse function.
Most of the energy is in the damped exponential.
Figure 10 shows that the spectrum and the extended data
are about what we would expect.
From the extrapolated data,
it is impossible to see where the given data ends.

