


The first synthetic
example is one previously used in chapter ![[*]](http://sepwww.stanford.edu/latex2html/cross_ref_motif.gif) to show how t-x prediction filtering can generate spurious events that appear
as wavelet distortions.
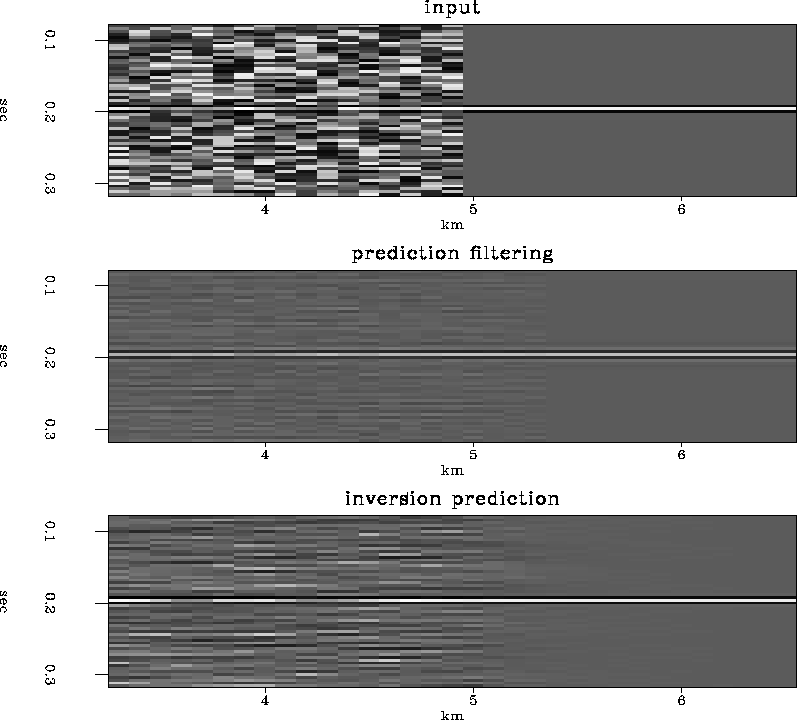
Figure shows how inversion prediction for the noise using
equation () compares to prediction filtering.
Although the inversion prediction
result shows more organized noise in the background than
the prediction-filtering result,
the amplitude of the signal is better preserved in the
inversion prediction result.
Close-ups of the wavelets are seen in Figure .
Notice that the input event has been distorted by the
t-x prediction-filter result.
While the inversion prediction result still shows some distortion
of the wavelet,
the distortion is small and the amplitude of the wavelet is better preserved
than it is in the prediction-filtering result.
to show how t-x prediction filtering can generate spurious events that appear
as wavelet distortions.
Figure shows how inversion prediction for the noise using
equation () compares to prediction filtering.
Although the inversion prediction
result shows more organized noise in the background than
the prediction-filtering result,
the amplitude of the signal is better preserved in the
inversion prediction result.
Close-ups of the wavelets are seen in Figure .
Notice that the input event has been distorted by the
t-x prediction-filter result.
While the inversion prediction result still shows some distortion
of the wavelet,
the distortion is small and the amplitude of the wavelet is better preserved
than it is in the prediction-filtering result.
 |


|
graph3
Figure 4 A single trace taken from the right side of the data. The original reflection on the top shows a three-point wavelet. The middle plot is the t-x prediction result. The bottom plot is the inversion prediction result. | 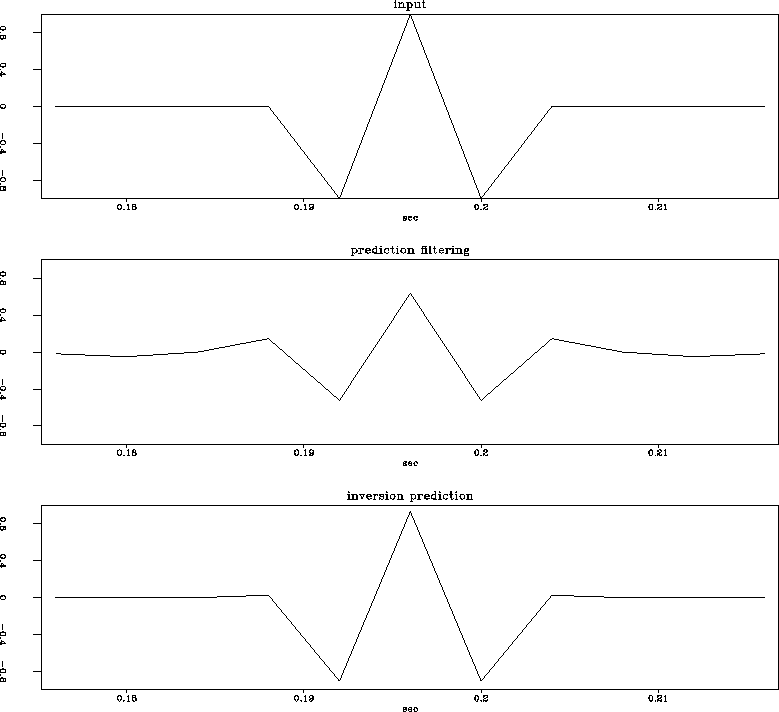 |