Both low- and high-frequency components of the reflectivity
series will not be correctly resolved by the
iterative process described by equation (6). When two
adjacent reflectivities with the same polarity are sufficiently
close, they will not be represented by distinguishable peaks
in the correlation series.
The method will ``see" a single reflectivity, with an amplitude
close to the sum of the amplitudes of the two actual reflectivities.
Similarly, if two close, adjacent reflectivities have opposite
polarity, the scaled correlation will still show two peaks but
with amplitudes smaller than the amplitudes of the original reflectivities.
One way to avoid the excessive influence of the initial picking
steps (which is crucial to retrieve the lower-frequency components of the
reflectivity) is to introduce a damping factor in equation (6)
| |
(7) |
| |
(8) |
| |
(9) |
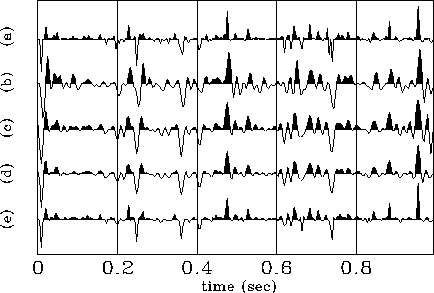
As suggested by Claerbout (1989), to generate a sparse synthetic sequence, we can take an integer power of a series comprised of Gaussian noise. I used the third power to build a synthetic reflectivity sequence, because it represents about the limit of resolution for wavelet estimation (for a white-spectrum wavelet). Figures 2 and 3 show a comparison between different approaches used to deconvolve the synthetic trace.
We can see from Figure 2 that when the basic operator is used (c) most of the major events are correctly recovered, but the low-frequency components of the reflectivities are not properly resolved (e.g., the negative event between 0.3 and 0.4 seconds). When a damping factor of 0.5 is introduced (d) the low-frequency components of the original reflectivity are better retrieved but the high-frequency components are still unresolved, as we can see by the events beyond 0.6 seconds. These events are better resolved in the last trace of this figure (e), which refers to the least-squares residual inversion applied to (d).
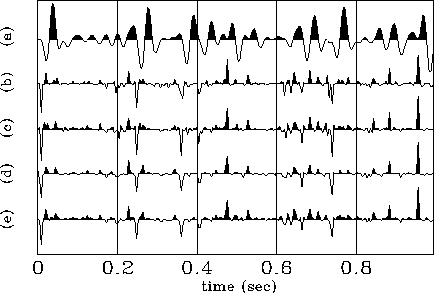 |
Figure 3 shows a comparison between the reflectivity series retrieved by different methods: predictive deconvolution in (b), convolution with the least-squares inverse of the wavelet in (c), direct least-squares inversion in (d), and the least-squares applied to the residuals of the damped, iterative correlation-picking decon (e) , which is the same as (e) in Figure 2. The direct least-squares and the correlation-picking deconvolutions correspond to the sequences that better fit the original series (a). It is clear, however, that the iterative correlation-picking (ICP) result has the same frequency content as the original sequence, while the least-squares inversion (LSI) corresponds to its lower-frequency version.
 |
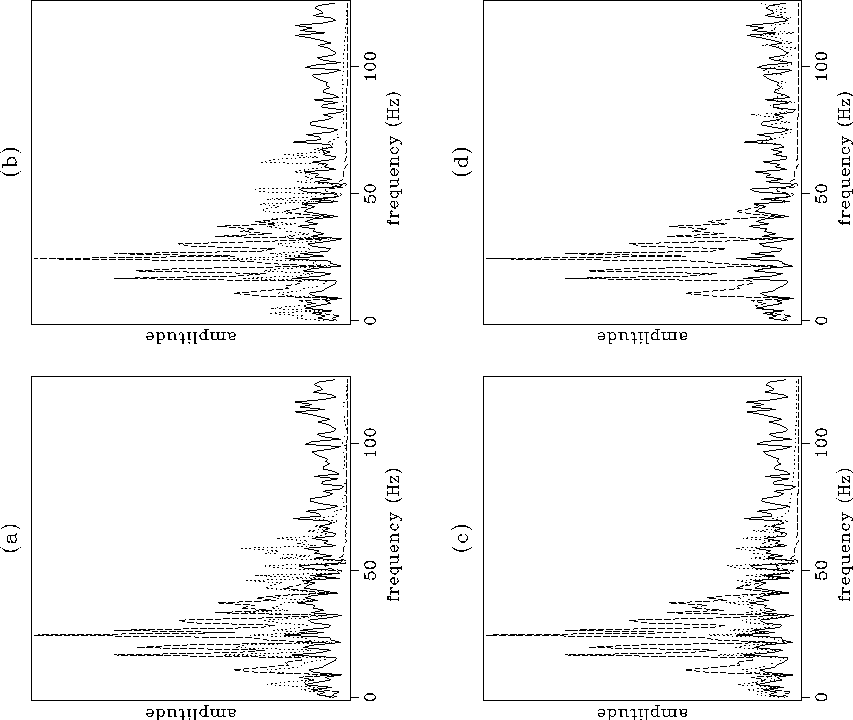
The spectra of the synthetic trace, the original reflectivity series, and the reflectivities recovered by each of the methods described in Figure 3, are shown in Figure 4. In the central frequency range of the original wavelet (10-50 Hz) all methods, except the predictive decon, correctly recover the shape of the reflectivity spectrum. Since the predictive decon does not use any information regarding the original wavelet (except that it is minimum-phase), its relative weakness compared to other methods would be expected. In the low-frequency region however, only the ICP and LSI algorithms properly retrieve the shape of the original reflectivities. All methods, except the ICP, show a decay for high frequencies that follows the same decay pattern of the trace (and wavelet) spectrum. That is why, although with the same shape, the spectra retrieved by those methods have a higher amplitude than the spectrum of the true reflectivities in the low and medium range of frequency.
The ICP algorithm, however, keeps the same amplitude level in the whole frequency domain, with two direct consequences: it exactly recovers both the shape and the amplitude of the original spectrum in the range of frequencies covered by the wavelet, and it loosely recovers the part of the spectrum that is not covered by the wavelet. This result is better than just zero this part of the spectrum.
 |
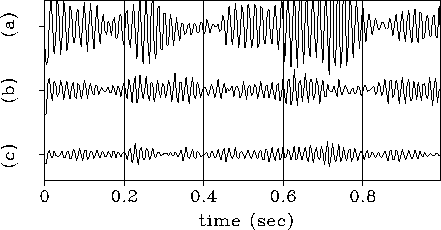
Final comparisons between the LSI and ICP algorithms are presented
in Figures 5 and 6. In the first of these figures,
I show that when the ICP algorithm with a residual least-squares step
is used, the residuals (![]() ) are smaller than those
of the LSI algorithm.
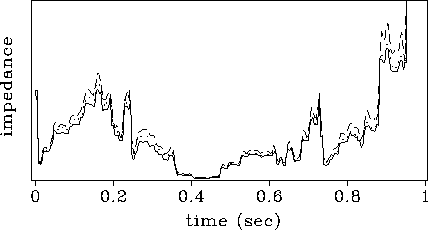
In Figure 6 I compare the impedance profiles obtained
from these two algorithms with the impedance obtained from the original
reflectivity series. The impedance obtained with the ICP method shows
a slightly better fitting of the true impedance, than the one
obtained with the LSI method.
) are smaller than those
of the LSI algorithm.
In Figure 6 I compare the impedance profiles obtained
from these two algorithms with the impedance obtained from the original
reflectivity series. The impedance obtained with the ICP method shows
a slightly better fitting of the true impedance, than the one
obtained with the LSI method.
 |
 |