 |
 |
 |
 | 3D shot-profile migration in ellipsoidal coordinates |  |
![[pdf]](icons/pdf.png) |
Next: Future Work
Up: 3D Implicit Finite-difference Propagation
Previous: Extrapolation Algorithm
We conducted impulse response tests on a 500 x 400 x 400 mesh in a
homogeneous medium with slowness  s/m. The initial wavefield
consisted of three smoothed point sources at
s/m. The initial wavefield
consisted of three smoothed point sources at
![$ t=[0.5,0.75,1]$](img90.png) seconds.
Using this experimental setup, we expect the impulse responses to
consist of three hemispherical surfaces of radii
seconds.
Using this experimental setup, we expect the impulse responses to
consist of three hemispherical surfaces of radii
![$ r=[1000, 1500,
2000]$](img91.png) meters. We used the narrow-azimuth coordinate system
pictured in figure 1.
meters. We used the narrow-azimuth coordinate system
pictured in figure 1.
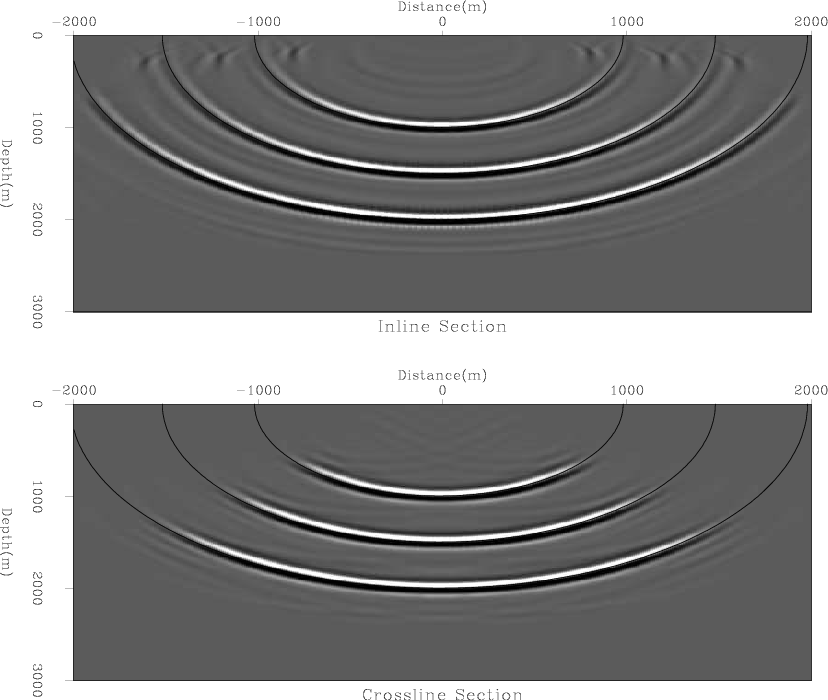
Figure 4's upper and lower panels show the inline and
crossline responses, respectively. To illustrate the
accuracy of the approach, we overlaid three lines showing the
analytical results. Note that the impulse responses are limited at
high angles both by the coordinate system boundaries and by the 50
sample cosine-taper function applied at the edges.
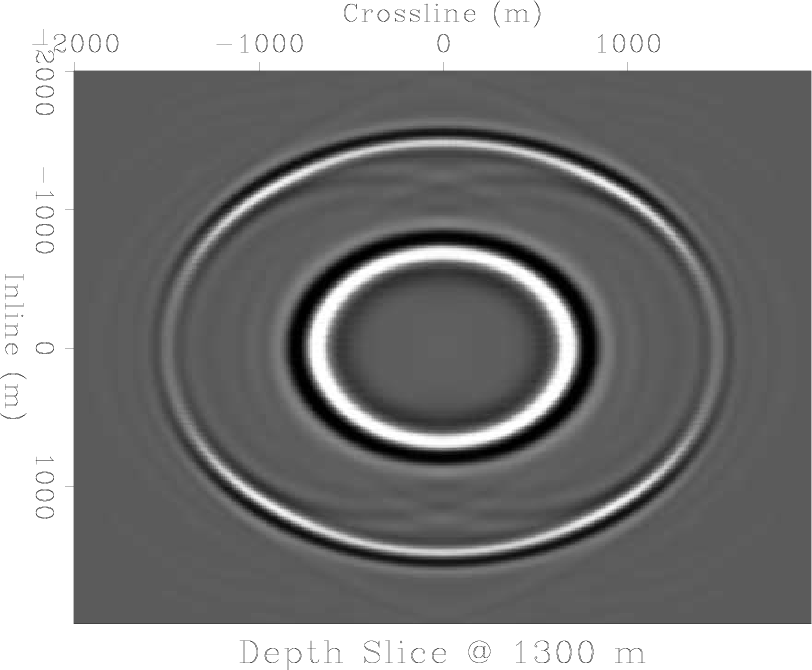
Figure 5 shows the 1300 m depth slice. The symmetric
response indicates that the Li filter has accounted for the numerical
anisotropy from the numerical splitting.
|
|---|
CrossIn
Figure 4. Ellipsoidal coordinate impulse
response cross sections through the 3D image volume for the
narrow-azimuth ellipsoidal coordinate system defined in
figure 1. Top panel: Inline response. Bottom
panel: Crossline response. [CR]
|
|---|
![[png]](icons/viewmag.png)
|
|---|
Depth1300
Figure 5. Image volume depth slice
taken at 1300m. Note the circular symmetry of the impulse response
and the stronger inline amplitudes relative to the crossline. [CR]
|
|
|
|
|---|
|
|
|
|
| 3D shot-profile migration in ellipsoidal coordinates | |
|
Next: Future Work
Up: 3D Implicit Finite-difference Propagation
Previous: Extrapolation Algorithm
2009-04-13