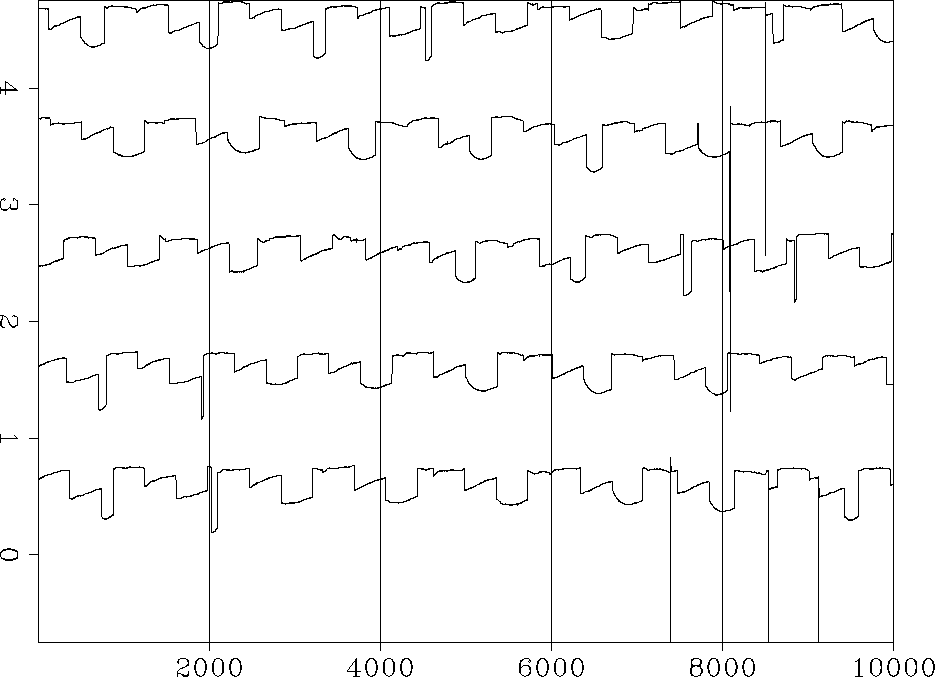
Even in the case of the Madagascar data set, just looking at the output model is not enough to determine the quality of the result. In this case, there were inaccuracies in the weight, ![]() , that were allowing some bad data points to slip into the fitting equations. There were only a few, so the model still looked good but observation of the data-space residual alerted us to a problem. Figure 9 shows the residual after convergence. The differences between each track should be constant, or near constant, shifts, so you would expect the residual to be comprised of constant or near constant shifts. This residual has a lot of curved features which were the result of the solver trying to fit the model to some bad data and spreading the errors out over the model.
, that were allowing some bad data points to slip into the fitting equations. There were only a few, so the model still looked good but observation of the data-space residual alerted us to a problem. Figure 9 shows the residual after convergence. The differences between each track should be constant, or near constant, shifts, so you would expect the residual to be comprised of constant or near constant shifts. This residual has a lot of curved features which were the result of the solver trying to fit the model to some bad data and spreading the errors out over the model.
 |
![[*]](http://sepwww.stanford.edu/latex2html/movie.gif)
 |
![[*]](http://sepwww.stanford.edu/latex2html/movie.gif)
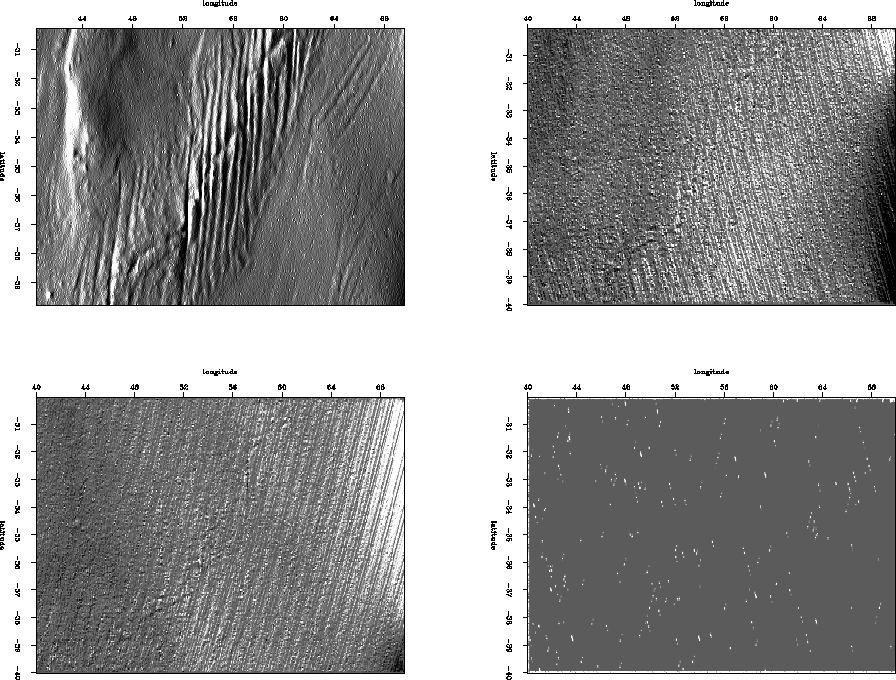
To see if there was a model space correlation in the position of the residual curves, I separated the residual into ascending and descending tracks, took the derivative along the tracks, and binned them. I took the derivative along the tracks to highlight steep or curved features. Figure 8 shows the binned residual. Notice the brightening and dimming on the right side of the ascending and descending tracks, respectively. This means that the curved features are all lining up on the right (west) side of the map. Then I looked at the binned weight and right away saw that there were no 0's on the right side of the map. Upon further examination it became clear that I was clipping the weight in model space, thus allowing all of the track ends along the right side of the map to slip into our fitting equations.
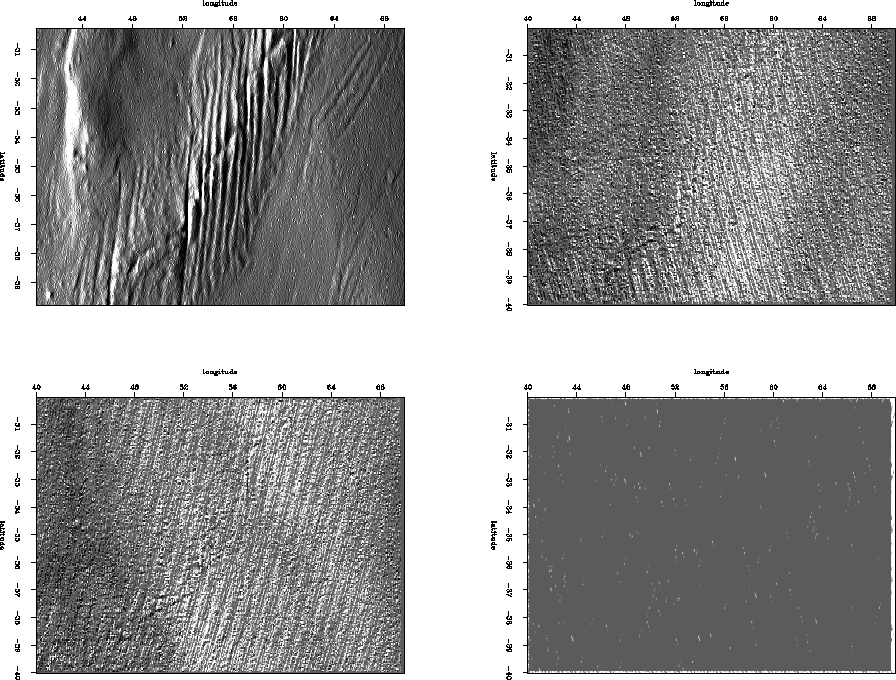
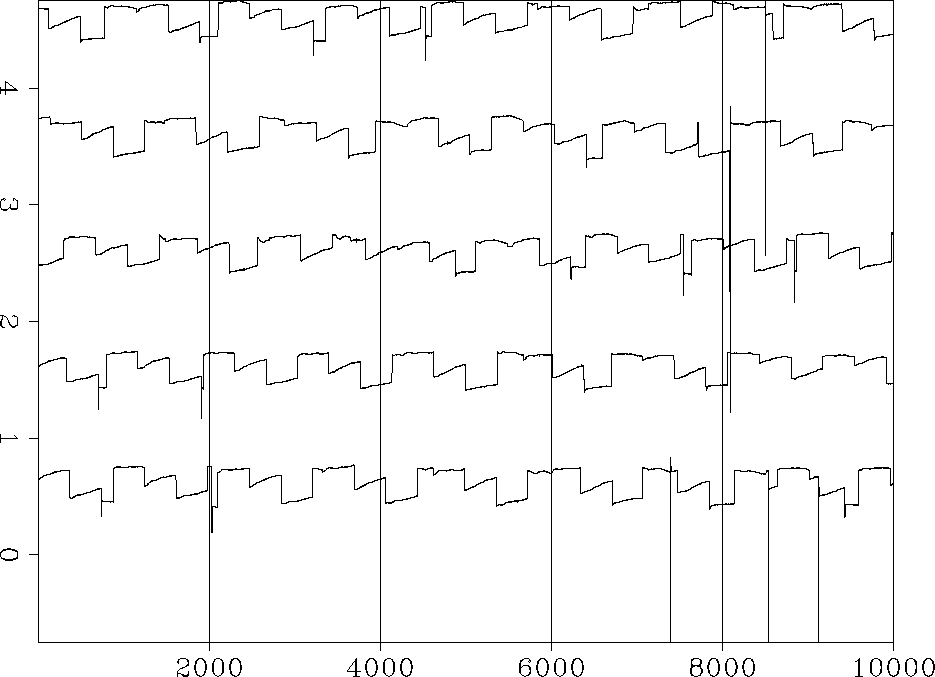
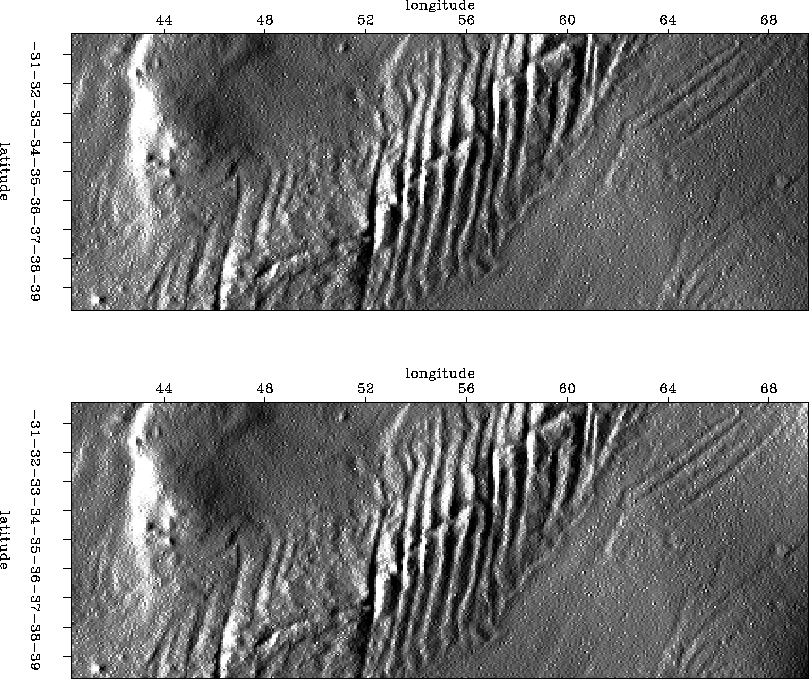
After correcting the problem, the residual looks more like it should as in Figure 11. Also the binned residual looks whiter and without the brightening and dimming as in Figure 10. Figure 12 compares the model with the correct weight to the model with the incorrect weight. The difference is slight, basically just a flexing on the right side of the map.
 |
![[*]](http://sepwww.stanford.edu/latex2html/movie.gif)
 |
![[*]](http://sepwww.stanford.edu/latex2html/movie.gif)
 |
![[*]](http://sepwww.stanford.edu/latex2html/movie.gif)