|
error1
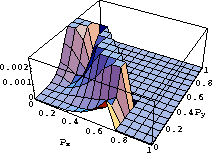
Figure 1 Errors in pz evaluated using equation 17 measured in s/km as a function of px and py. The orthorhombic model has vv=1 km/s, v1=1.1 km/s, |  |
Before we use the new dispersion relation to derive an acoustic wave equation we must first investigate how accurate is this dispersion equation in representing elastic media. Specifically, I will measure the error associated with equation 17 with respect to the elastic equation. The dispersion relation for elastic media is evaluated numerically. Since the isotropic dispersion relation is independent of the shear wave velocity, and it's acoustic version is exact, the errors corresponding to the acoustic dispersion equation is expected to be dependent on the strength of anisotropy.
|
error1
Figure 1 Errors in pz evaluated using equation 17 measured in s/km as a function of px and py. The orthorhombic model has vv=1 km/s, v1=1.1 km/s, |  |
Figure 1 shows a 3-D surface plot of the error in pz evaluated using equation 17 as a
function px and py. The error is given
by the difference between pz measured using equation 17 and that using the elastic equation, with
non-zero shear wave velocities. In fact, the reference
elastic medium has shear wave velocities equal to half the vertical P-wave velocity (
vs1= vs2= vs3=0.5 km/s). Since the vertical P-wave velocity
in all the examples equal 1 km/s, pz can have a maximum value of 1 and a minimum of zero. The Orthorhombic model used
in Figure 1 has v1=1.1 km/s, ![]() , v2=1.2 km/s,
, v2=1.2 km/s, ![]() ,
and
,
and ![]() =0.1. This model is practical with a strength of anisotropy that is considered moderate.
Clearly, the errors given by a maximum value of 0.002 is extremely small suggesting
that equation 17 is accurate for this case. Equation 17 is exact for zero and 90 degree dip
reflectors, and therefore,
most of the errors occur at angles in between. However, such errors are clearly small.
=0.1. This model is practical with a strength of anisotropy that is considered moderate.
Clearly, the errors given by a maximum value of 0.002 is extremely small suggesting
that equation 17 is accurate for this case. Equation 17 is exact for zero and 90 degree dip
reflectors, and therefore,
most of the errors occur at angles in between. However, such errors are clearly small.
|
error1s
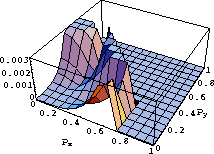
Figure 2 Errors in pz evaluated using equation 17 measured in s/km as a function of px and py. The orthorhombic model has vv=1 km/s, v1=1.1 km/s, |  |
From my earlier experience Alkhalifah (1997a), errors in the acoustic approximations increase with increasing shear wave velocity. Obviously, if shear wave velocity equals zero no errors are incurred. Figure 2 shows the same model used in Figure 1, but with higher shear wave velocities. Specifically, vs1=0.6 km/s, vs2=0.7 km/s,and vs3=0.7 km/s. Here, the vertical S-wave to P-wave velocity ratio equal 0.6, which can be considered as an upper limit for most practical models in the subsurface. Yet, the errors given by the acoustic approximations (maximum error equal to 0.003) is still extremely small.
|
error2
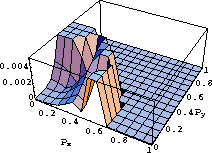
Figure 3 Errors in pz evaluated using equation 17 measured in s/km as a function of px and py. The orthorhombic model has vv=1 km/s, v1=0.9 km/s, |  |
To test the limits of the new dispersion relation, I use an orthorhombic model of strong anisotropy.
Specifically, v1=0.9 km/s, ![]() , v2=1.2 km/s,
, v2=1.2 km/s, ![]() , and
, and ![]() =0.3.
The strength of anisotropy in this test is given by the high
=0.3.
The strength of anisotropy in this test is given by the high ![]() ,
, ![]() , and
, and ![]() values. I also
use for the elastic equation high shear wave velocities given by vs1=0.7 km/s, vs2=0.8 km/s,and
vs3=0.8 km/s.
Figure 3 shows a 3-D surface plot of the error in pz evaluated using equation 17 as a
function px and py. The errors are slightly larger than those in Figures 1 and 2,
but overall acceptable. The maximum
error of about 0.004 is much smaller than the possible range of pz.
values. I also
use for the elastic equation high shear wave velocities given by vs1=0.7 km/s, vs2=0.8 km/s,and
vs3=0.8 km/s.
Figure 3 shows a 3-D surface plot of the error in pz evaluated using equation 17 as a
function px and py. The errors are slightly larger than those in Figures 1 and 2,
but overall acceptable. The maximum
error of about 0.004 is much smaller than the possible range of pz.
|
error2s
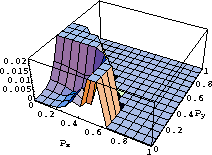
Figure 4 Errors in pz evaluated using equation 17 measured in s/km as a function of px and py. The orthorhombic model has vv=1 km/s, v1=0.9 km/s, |  |
However, there is a limit to what kind of shear wave velocities the elastic media can have before this acoustic approximation breaks down. Figure 4 shows the errors for the same model in Figure 3 with even higher shear wave velocities. Specifically, vs1=vs2=vs3=0.9 km/s. Suddenly the acoustic approximation incurs large errors, up to 0.02 in the value of pz over a possible range of 1. However, note that such a model given by vs1=vs2=vs3=0.9 km/s is highly unlikely considering that the vertical P-wave velocity equal 1 km/s. This constitutes an extreme orthorhombic anisotropy model that probably does not exist in the subsurface.
|
errorVTI
Figure 5 Errors in pz evaluated using equation 17 measured in s/km as a function of px and py. The VTI model has vv=1 km/s, v1=1.1 km/s, |  |
For comparison, Figure 5 shows this same error test, however for a VTI model. The model is given by
v1=1.1 km/s, ![]() , v2=1.1 km/s,
, v2=1.1 km/s, ![]() ,
and
,
and ![]() =0. The error size is very similar to that in Figure 1, but more symmetric since the VTI model
exerts symmetry on the horizontal plane.
=0. The error size is very similar to that in Figure 1, but more symmetric since the VTI model
exerts symmetry on the horizontal plane.
In summary, the dispersion relation given by equation 17 is, for all practical purposes, exact. Thus, the acoustic wave equation extracted from this dispersion relation is expected to be accurate as well.