

Next: Forward Modeling and AVO
Up: Ecker, et al.: Hydrate
Previous: High-Frequency Saturation
After determining the hydrate and gas saturations based only
on surface seismic information, we use wells logs from the area of the Blake
Outer Ridge to validate our technique and the obtained hydrate estimates.
wells
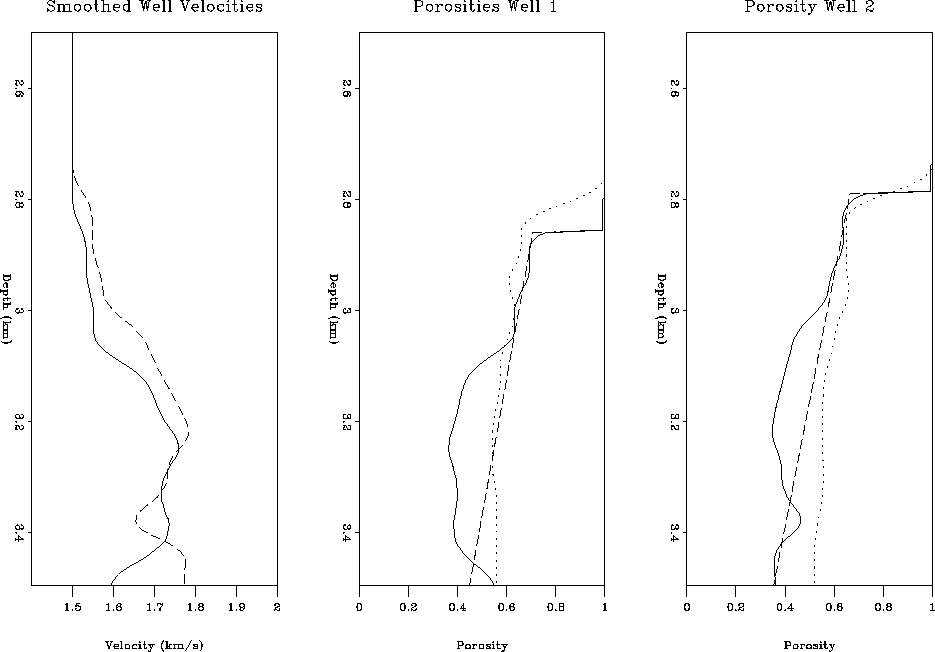
Figure 12 The left panel shows the
velocities of well 1 (solid line) and well 2 (dashed line). The middle and right panel display the real porosities (dotted lines), the baseline porosities (solid lines) and the fitted normal brine porosities (dashed lines).


We show in the left panel of Figure 12 two smoothed well
velocities
from wells 994 and 995 Matsumoto et al. (1996). The middle and the right
panels contain the original porosities obtained from cores (dotted lines),
the baseline porosities determined with our rock-physics models and
assuming 100% brine saturation of the sediments (solid line), and the
polynomial regression representing the normal brine porosity (dashed line).
It is obvious that for well 1, the real porosity and inferred
normal brine porosity are in good agreement. This good fit of the porosities
suggests that the sediment mineralogy assumed in our modeling appears to be
a good approximation of the real mineralogy at this spot.
Well 2 displays a slight discrepancy between the porosities, thus implying
deviation of the model and in-situ conditions.
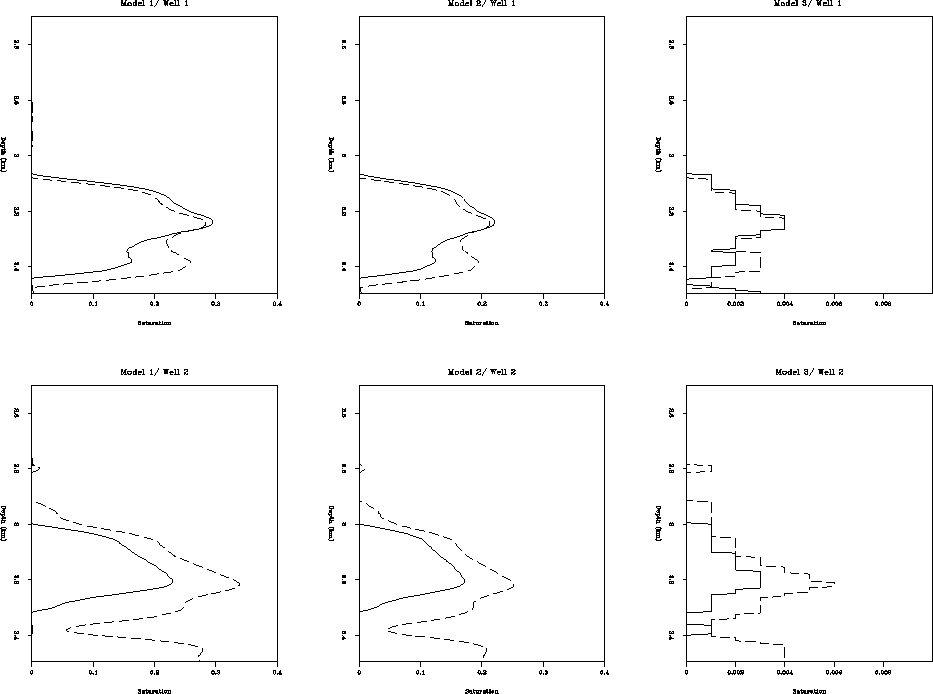
Subsequently, we determine the hydrate saturations both from the residual
between the baseline porosity and the real porosity, and from the
residual between the baseline porosity and the fitted normal porosity.
The results are shown in Figure 13.
wellsat
Figure 13 Saturation estimates using the real porosities (dashed lines) and the fitted normal porosities (solid line).


The saturation estimates for well 1 are in close agreement as expected. Hydrate model 1 results in a maximum saturation of about 30 %, model 2 of
about 22 % and model 3 of less than 1%. Well 2 shows a larger discrepancy
between the estimates obtained from the real in-situ porosities and those
obtained from our technique. The real porosities (dashed line) result in
about 10 % higher saturation values.
The overall saturation levels are, however, consistent with
those obtained from surface seismic.
Consequently, we can conclude that our technique of estimating
hydrate and gas saturation from surface seismic yields reasonable results
in the region of the Blake Outer Ridge.


Next: Forward Modeling and AVO
Up: Ecker, et al.: Hydrate
Previous: High-Frequency Saturation
Stanford Exploration Project
10/9/1997

