After using the interval velocities to obtain lateral hydrate and gas saturation estimates, we also explore the possibility of obtaining more structural saturation maps. This is done by constructing a full impedance section which contains both the low-frequency information of the interval velocities and the high-frequency reflectivity. This impedance section can then be inverted for the hydrate and gas saturations by the same method we described in the previous sections.
The construction of the impedance section is divided into two parts. First, we derive a ``low-frequency'' impedance section by multiplying the seismic interval velocities with an appropriate density. This density is obtained while forward modeling the saturated sediment moduli to fit the seismic velocities and infer hydrate/gas saturations. Multiplication of the so determined density results in an impedance which, when inverted for saturation, will yield the same answer as when inverting using only the velocity. Subsequently, we determine the ``high-frequency'' impedance directly from the seismic data. Ecker 1997 showed how the seismic data can be inverted for P-impedance contrasts, which is essentially equal to twice the reflectivity R. Starting from the known water impedance, the high-frequency impedance can then be obtained by integration of the reflectivity R(t):
| (11) |
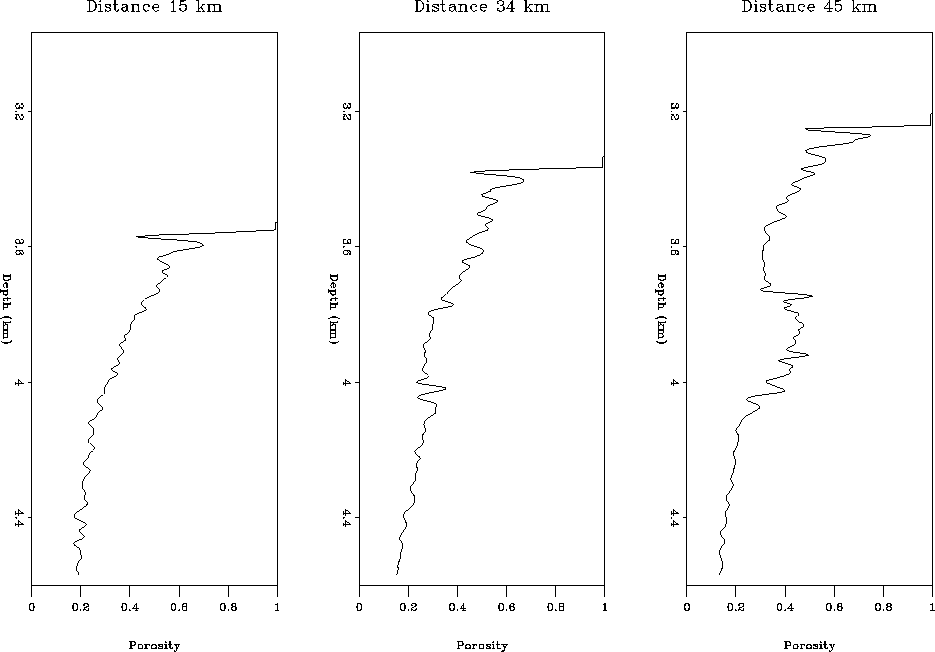
Three of the baseline porosity curves are shown in Figure 10. They show the additional wave-effects introduced by the reflectivity.
 |
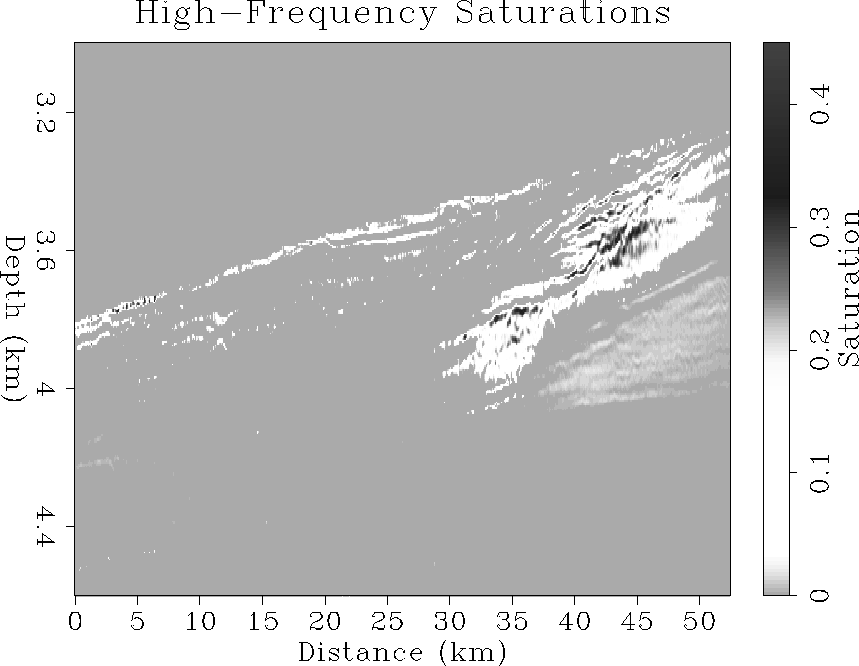
The porosity anomalies caused by the hydrate and gas saturations can be transferred into actual saturation estimates by the same methods described in the previous sections. For normal brine trends we use those calculated from only the velocities. This results in saturation maps which show more structural detail. Here we show as a representation the saturation map resulting from the trace-by-trace method and hydrate model 1.
 |