

Next: CONCLUSION
Up: TESTS
Previous: Synthetic Data
I also tested the method on a portion of a real 3-D marine data set.
The test is very small, because I have not yet
done the necessary software
engineering to make the code work quickly on a large data set.
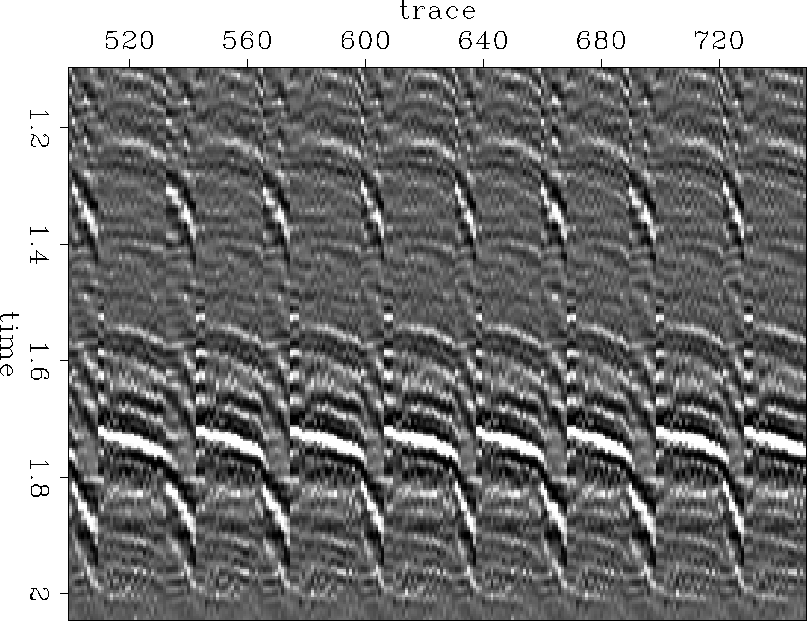
A portion of the input data is shown in Figure 6,
and the corresponding part of the output Figure 7.
The output have been rotated in time to make comparison with the input easier.
What is encouraging about the results is
that most of the reflectors are easily visible in the output, have not
been damaged by aliasing, and in some cases are more coherent than in
the input (in particular the reflector at approx. 1.55 s).
What is discouraging is that certain reflectors, especially those in
the neighborhood of 1.3 s, which are somewhat less consistent from
input gather to input gather, have been strongly attenuated in the output.
I am hopeful that it will turn out this is an artifact of the input data
set's size and the necessarily small aperture.
I am encouraged that events such as the one at 1.25 s die out
as they approach zero inline offset.
Also discouraging is the glaring artifact at 1.3 to 1.4 s, in
the steep moveout traces.
For the most part this artifact is in the mute zone of the traces where it
appears, but that isn't true everywhere.
It looks disturbingly like a replication of the event at 1.8 s.
The code is not well tested, I suspect some technical problem.
fieldIn
Figure 6 Inlines from input 3-D marine data.


 fieldOut
Figure 7 3-D marine data after upward continuation.


Next: CONCLUSION
Up: TESTS
Previous: Synthetic Data
Stanford Exploration Project
11/11/1997


