

Next: Field Data
Up: TESTS
Previous: TESTS
I tested the method on two synthetics, a simple layer model and
a point diffractor model.
The synthetic reflector example is boring, but illustrates the point that
the integral operator can be safely antialiased in poorly sampled data,
allow high frequency energy moving crossline,
and maintain high bandwidth in the output.
The layer synthetic after upward continuation is shown in Figure 4.
The left side of the figure shows the data after upward continuation without
any antialiasing.
The right side shows the data after upward continuation with antialiasing.
The reflection appears to have been 'safely' antialiased but still has
excellent frequency content.
layer
Figure 4 Crosslines from upward continued layer synthetic without (left) and with (right) antialiasing. Antialiasing results in more bandwidth in the output. The input is not shown.
The dark artifact .4 s below the reflection is present in the input; it is caused by the Kirchhoff modeling routine.


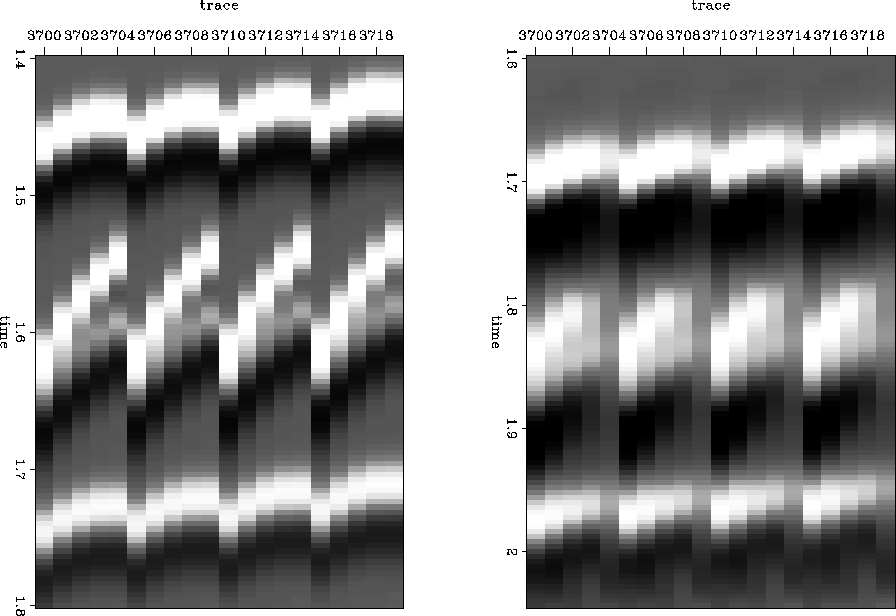
The point diffractor example, shown in Figure 5,
is more difficult,
because the geologic structures exist at individual midpoints.
The example is also a difficult test because it has
some barely distinguishable events,
and because upward continuation will flatten moveouts, the overlapping
events at 1.6 s in the input (shown on the left) are bound to be pushed together even more.
Though the output (right) shows some degradation and low pass,
it is good to see that the
overlapping events are still somewhat distinguishable.
pointScat
Figure 5 Crosslines from synthetic point scatter data (left), and after upward continuation (right). This is a difficult
test because nearly identical input moveouts are flattened and pushed together
more by upward continuation.


Next: Field Data
Up: TESTS
Previous: TESTS
Stanford Exploration Project
11/11/1997

