

Next: Salt dome (Gulf of
Up: FIELD DATA EXAMPLES
Previous: FIELD DATA EXAMPLES
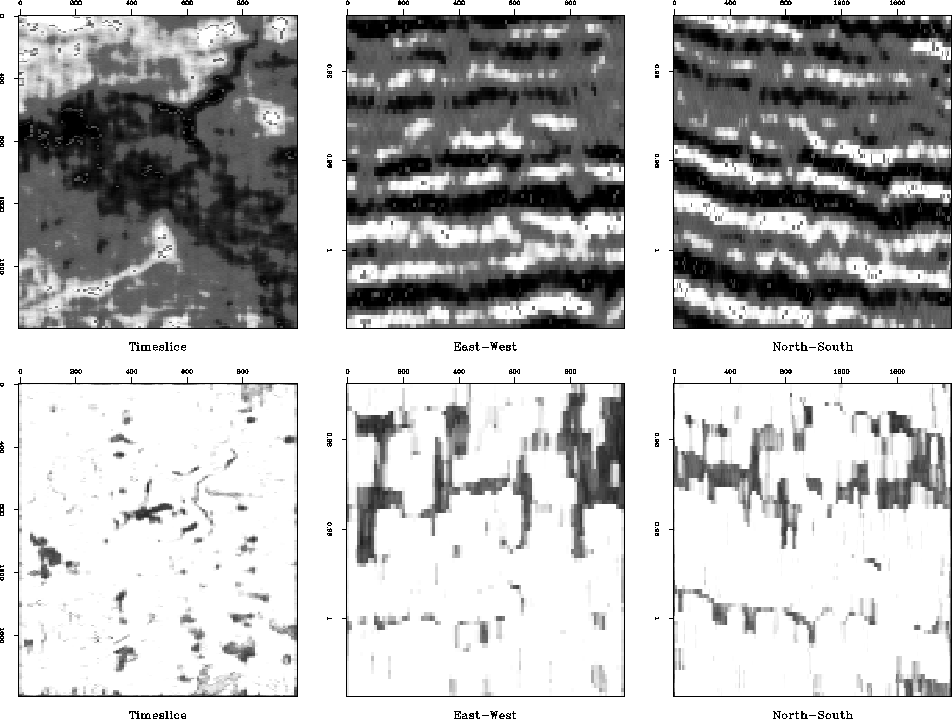
The top-left subsurface time-slice in Figure 5 displays
a buried river channel that meanders diagonally
from the South-West to the North-East corner.
The time-slice possibly contains an entire channel system besides
the single visible river channel.
The buried river channel is
embedded in gently dipping beds that generally strike
South-East to North-West and are cut by the channel's sediments.
The vertical cross-sections
illustrate the gentle reflector dip.
The bottom row of Figure 5 shows a
coherency image by CTC![[*]](http://sepwww.stanford.edu/latex2html/foot_motif.gif) The CTC coherency time-slice clearly delineates the edge of the river.
In addition to the major river channel,
the CTC coherency time-slice displays additional discontinuities which are
not obvious in the original image.
These events could be spurious events from other time-slices
or could indicate an underlying channel system that is not visible
in the original time-slice.
Overall, the image has an almost binary character in which locations
are flagged as being part of an edge or of an
homogeneous reflector volume.
The CTC coherency time-slice clearly delineates the edge of the river.
In addition to the major river channel,
the CTC coherency time-slice displays additional discontinuities which are
not obvious in the original image.
These events could be spurious events from other time-slices
or could indicate an underlying channel system that is not visible
in the original time-slice.
Overall, the image has an almost binary character in which locations
are flagged as being part of an edge or of an
homogeneous reflector volume.
texRaw
Figure 5
Migrated image and coherency volume of a fluvial reservoir system.
The top row displays slices of the migrated image volume,
the bottom row displays corresponding slices of a CTC
coherency volume.
From left to right:
time-slice, East-West, and North-South section.


texPef
Figure 6
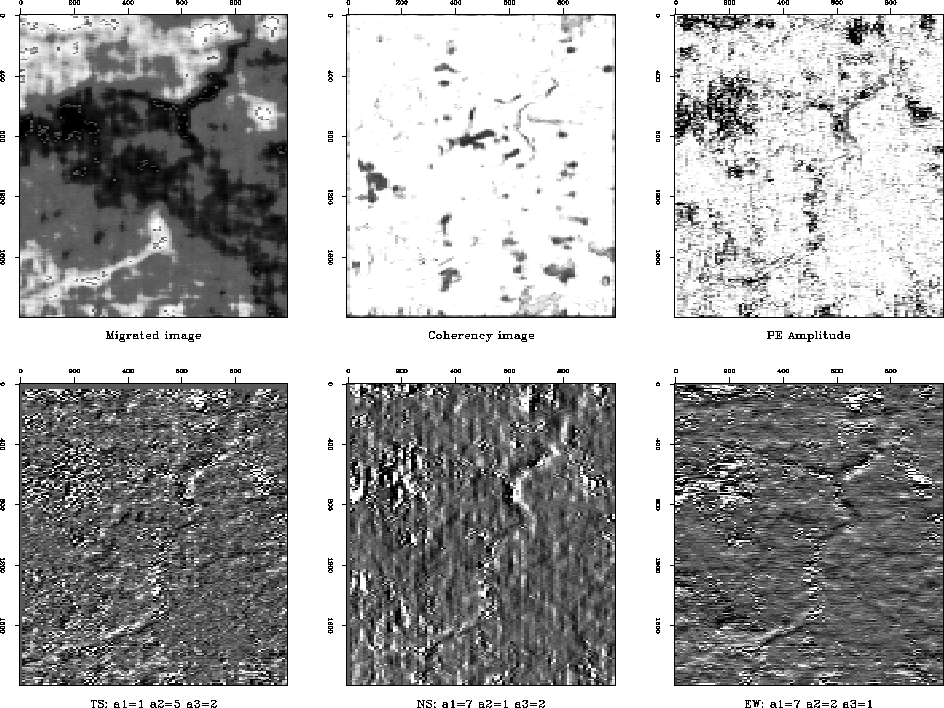
Time-slices of the migrated, Lomoplan and Coherency volumes.
Top row:
Migrated image, coherency measure,
magnitude of the Lomoplan components.
Bottom row:
Lomoplan outputs
with time-slice, East-West, North-South predictions.


The Lomoplan outputs at the bottom of Figure 6
successfully reject the image's smooth reflectors
and delineate the major channel.
Unlike
the CTC coherency time-slice, the Lomoplan image does not
indicate the channel's edge points uniformly.
The edges are highlighted by an elusive light-shadow effect
that corresponds to the filter's prediction directions.
Some isolated strong values in the original data
result in some strong-amplitude, high-frequency residuals.
Unfortunately,
the application of a spatial
low-pass filter
to the Lomoplan output
failed to suppress these
events without deteriorating the image of the channel significantly.
Lomoplan does not show the complex channel system that
the coherency data shows.
This might demonstrate Lomoplan's
superior resolution or its inferior sensitivity
depending on whether one
believes in the existence of the channel system or not.
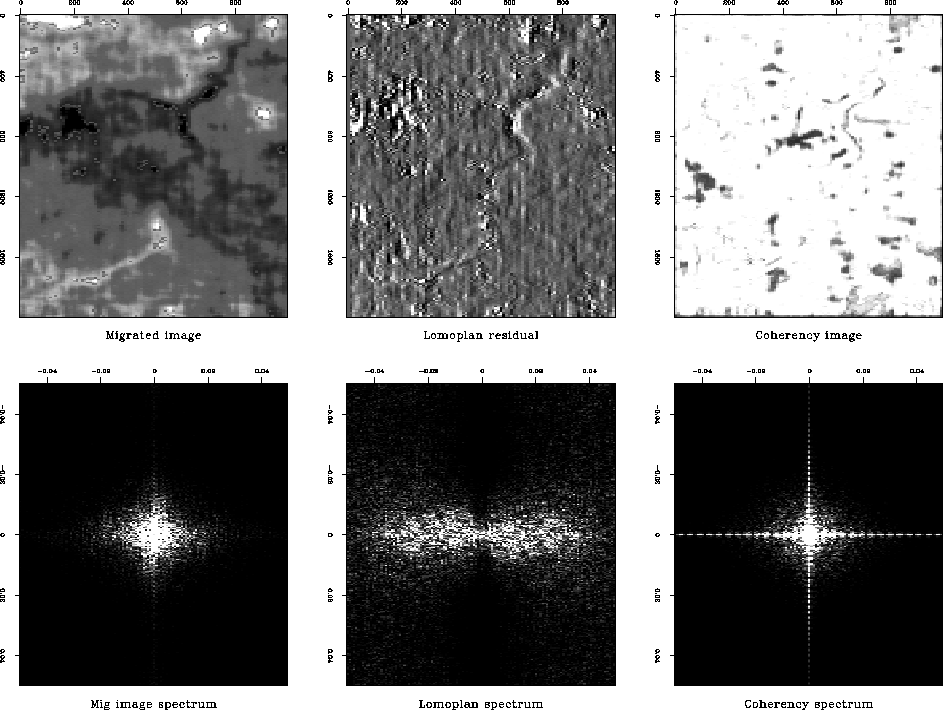
To highlight the differences between the Lomoplan images and the CTC coherency image, we computed the amplitude spectrum of the various
time-slices.
Figure 7 displays the original time-slice images in the
top row and the corresponding amplitude spectra in the bottom row.
Each spectrum is normalized to a total energy of 1 and all spectra
are clipped with the same value.
texSpc
Figure 7
Amplitude spectrum of various time-slice images of a
Texan fluvial reservoir system.
The top row displays the subsurface images,
the bottom row displays the corresponding amplitude
spectra (zero frequency is at the center).
From left to right:
migrated field data, East-West Lomoplan output,
CTC image.


The original time-slice image
has a low frequency power spectrum
(see Figure 7).
The Lomoplan East-West prediction error filter
removes the predictable East-West energy and
causes a vertical low energy band in the spectral plot
(see bottom center plot of Figure 7).
The splitting and merging of the original image
to process individual subcubes
is not noticeable
in the power spectrum.
Finally, the power spectrum of the CTC coherency time-slice
displays two distinct components:
it contains a low frequency component which is similar to the amplitude
spectrum of the original subsurface image.
Additionally, the spectrum contains
a modulated, cross-shaped component along the zero frequency axes.
The low frequency component surprised us,
since we expected the coherency cube to whiten the spectrum.


Next: Salt dome (Gulf of
Up: FIELD DATA EXAMPLES
Previous: FIELD DATA EXAMPLES
Stanford Exploration Project
11/12/1997
![[*]](http://sepwww.stanford.edu/latex2html/foot_motif.gif) The CTC coherency time-slice clearly delineates the edge of the river.
In addition to the major river channel,
the CTC coherency time-slice displays additional discontinuities which are
not obvious in the original image.
These events could be spurious events from other time-slices
or could indicate an underlying channel system that is not visible
in the original time-slice.
Overall, the image has an almost binary character in which locations
are flagged as being part of an edge or of an
homogeneous reflector volume.
The CTC coherency time-slice clearly delineates the edge of the river.
In addition to the major river channel,
the CTC coherency time-slice displays additional discontinuities which are
not obvious in the original image.
These events could be spurious events from other time-slices
or could indicate an underlying channel system that is not visible
in the original time-slice.
Overall, the image has an almost binary character in which locations
are flagged as being part of an edge or of an
homogeneous reflector volume.


