|
semis2
Figure 9 Semblance for microseismic data, record R2. |  |
To suppress the signal from the surface source and look for sources at depth, we applied the surface noise suppression method described above. A single recorded trace was used as the first estimate of the source signal. Figures 10 and 13 shows the results of the semblance computation after surface noise source suppression. It is clear that the effect of the surface noise source has been reduced somewhat on both records.
We theorized that we could do a better job of suppressing the surface noise source if we came up with a better estimate of the source signal. From Figure 2, we can measure the apparent velocity and azimuth that characterize arrivals from the surface source. Using these parameters, we can compute the moveout trajectory of energy coming from that source, and stack the data along that trajectory. This stacked trace should be a better estimate of the source signal than a single trace, because only the energy from the surface source will stack constructively. Figures 10 and 14 show the semblance after suppressing the surface source, using the stacked trace as the source signal. The two source signal estimates give rather similar results. We think that this similarity shows that the surface source is much stronger than all other sources, since the benefits derived from stacking were not very large.
Suppression of the surface source appears to have revealed a source at a depth of around 1 kilometer for record R3, but not for record R2. Note the similarity between the result for R3 and the results for the synthetic dataset presented earlier. If we believe the results of R3, why is the picture so different for R2? Perhaps a better source estimation method would improve the results for R2, or perhaps the source was more active during the recording of record R3.
|
semis2
Figure 9 Semblance for microseismic data, record R2. |  |
|
is2r
Figure 10 Semblance for microseismic data, record R2, after surface noise suppression. Data from one channel were used as the source signal in the noise suppression algorithm. | 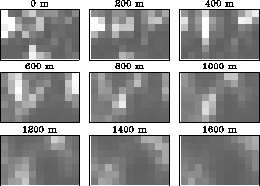 |
|
se2ra
Figure 11 Semblance for microseismic data, record R2, after surface noise suppression. Here we computed the source signal for the noise suppression algorithm by stacking the data along the moveout trajectory appropriate for the nearby surface source. | 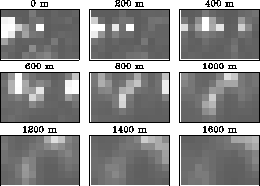 |
|
semis3
Figure 12 Semblance for microseismic data, record R3 | 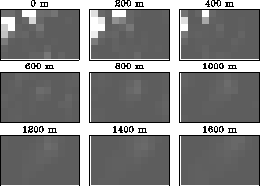 |
|
semis3R
Figure 13 Semblance for microseismic data, record R3, after surface noise suppression. Data from one channel were used as the source signal in the noise suppression algorithm. | 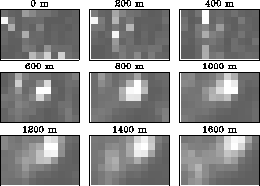 |
|
se3es
Figure 14 Semblance for microseismic data, record R3, after surface noise suppression. Here we computed the source signal for the noise suppression algorithm by stacking the data along the moveout trajectory appropriate for the nearby surface source. | 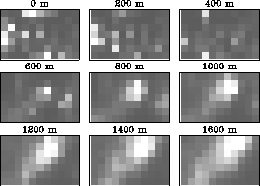 |