If we can estimate the signal generated by a particular source, then we can eliminate the influence of that source from the data using a least-squares technique to be discussed here. An important step, however, will be determining the source signal to be used in the suppression algorithm.
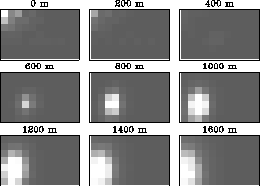
To test our method of surface noise suppression, we created a synthetic dataset with a single source at a depth of 1000 meters, and added uncorrelated noise with a signal to noise ratio of 1:1. Figure 6 shows the semblance computed for constant-depth slices of the 3-D volume. The dimensions of each panel correspond to the dimensions of the array. The maximum semblance is obtained, as expected, on the panel corresponding to a depth of 1000 meters.
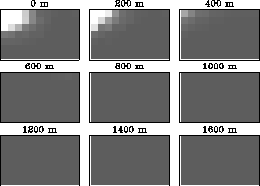
Next we added a strong surface noise source at a distance of 3 km from the array, with the power of the surface source 100 times the power of the buried source. Figure 7 shows semblance results for the two-source case. The strong surface source has effectively hidden the weaker source at depth.
Given an estimate of the signal of the surface source, we can suppress it using the following formula: (Jenkins, 1968):
![]()
where Xi(f), X0(f), Xir(f) are the Fourier transforms of
the ith trace, the reference trace (the source signal) and the residual
trace, respectively.
![]() is a smoothed estimate of the cross-spectrum
between the reference trace and trace i,
and
is a smoothed estimate of the cross-spectrum
between the reference trace and trace i,
and ![]() is
the power spectrum of the reference trace.
is
the power spectrum of the reference trace.
What are we to use for the source signal? As a first guess, we took the data from one recorded channel and used it as the source signal. Figure 8 shows the semblance result computed after applying the noise suppression technique. The influence of the surface source has been removed almost completely, and it is now possible to identify the deep source.
|
sesi1
Figure 6 Semblance computed from synthetic data with one source located at a depth of 1000 meters. |  |
|
sem2
Figure 7 Semblance from synthetic data with one source located at a depth of 1000 meters and a surface source whose amplitude is ten times larger. The weaker source at depth is effectively masked by the strong surface source. |  |
|
sr10
Figure 8 Semblance from synthetic data after suppression of the strong surface noise source. It is now possible to see the source at depth once again. |  |