


The stack of the common azimuth migration (CAM) result (upper panels of
Figures ![[*]](http://sepwww.stanford.edu/latex2html/cross_ref_motif.gif) and )
of this 3-D cube is good, indicating that
the velocity model is fairly accurate. There are 3-D faults
visible away from the salt. Under the salt, the shadow zones caused by
poor illumination are easy to identify, although they are full of noise
and artifacts.
and )
of this 3-D cube is good, indicating that
the velocity model is fairly accurate. There are 3-D faults
visible away from the salt. Under the salt, the shadow zones caused by
poor illumination are easy to identify, although they are full of noise
and artifacts.
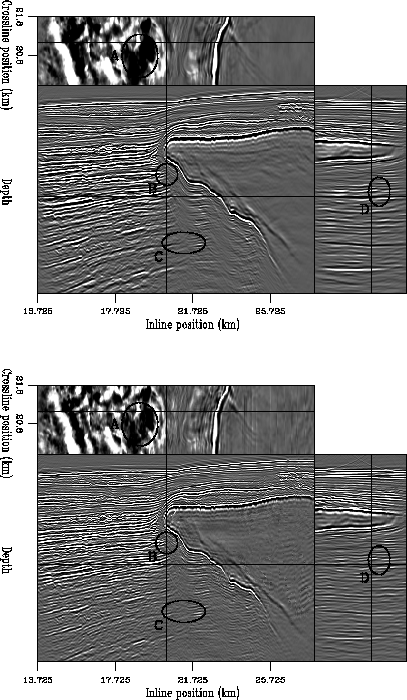
I performed 7 iterations of 3-D geophysical RIP. The result of the stack
can be seen in the lower panels of Figure and
Figure . The two figures display different inline,
crossline,
and depth slices, but the types of improvements are the same. In both
figures, ovals on the stacked migration
result and the stacked geophysical RIP result indicate particular areas where
RIP has improved the image. The improvements are fairly modest, due to the
small number of iterations performed.
The ovals marked as ``A'' appear on the depth slices and indicate increased resolution of faults that are located away from the salt, but whose imaging depends on energy that has been affected by passing through the salt. The ovals marked as ``B'' indicate reflectors close beneath the nose of the salt which have more consistent amplitudes in the RIP results. The greatest improvement can be seen in oval ``C'', where the migration results show a strong up-sweeping artifact in the shadow zone that has been significantly reduced in the RIP results. With that artifact gone, the improvement in the imaging of the reflector passing through the center of the oval is more obvious. After 7 iterations of RIP, this reflector can be traced, though weakly, through almost the entire shadow zone. The ovals marked ``D'' indicate a fault beneath the salt that is better imaged with RIP.
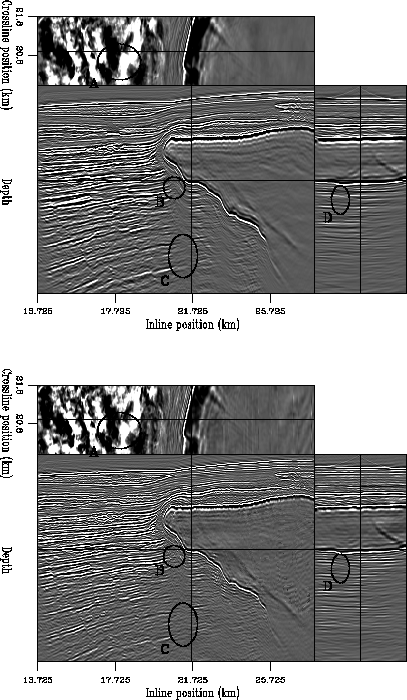
The improvements made by RIP can be seen better by zooming in under the
salt. Figures and show the
stacked 3-D migration on top and the stacked RIP result after 7 iterations
on the bottom. In Fig. , oval ``A'' indicates reflectors
that can be followed under the salt nose after imaging with RIP. Ovals
``B'', ``C'', and ``D'' show areas on the inline section where the reflectors
can be traced almost entirely through the shadow zones after RIP. In
the crossline section, many more reflectors are seen after RIP,
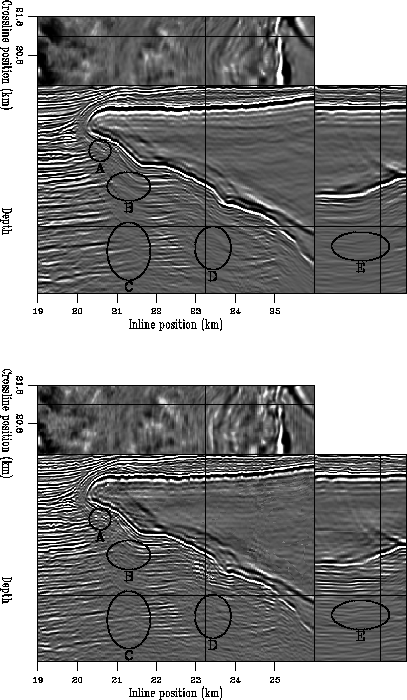
particularly in oval ``E''. In Fig. , ovals
``A'',``B'', and ``C'' show areas on the inline section where
the reflectors can be traced almost entirely through the shadow zones after
RIP and oval ``D'' shows reflectors and a possible fault in the
crossline section.
It is not surprising that the comparison of the migration stack and the
RIP stack show less impressive improvements than seen in the 2-D example.
Performing only 7 iterations
of geophysical RIP, which is regularizing only the inline ph axis,
will not change the image enough to show significant effects in the
stacked volumes. Although there were more substantial
improvements in the stacks after 6 iterations of RIP on a 2-D line taken
from this dataset (Fig. ), inverting a 3-D problem means
that it can take many more iterations to get similar improvements.
 |
![[*]](http://sepwww.stanford.edu/latex2html/movie.gif)


 |
 |
 |