

Next: Summary
Up: 3-D results
Previous: Comparison of 3-D stacked
Using CAM as the imaging operator in my least-squares inversion means that
my geophysical regularization operator will only be acting along the inline
ph axis. Therefore, the most significant changes between the CAM
result and the geophysical RIP result will be seen in unstacked results.
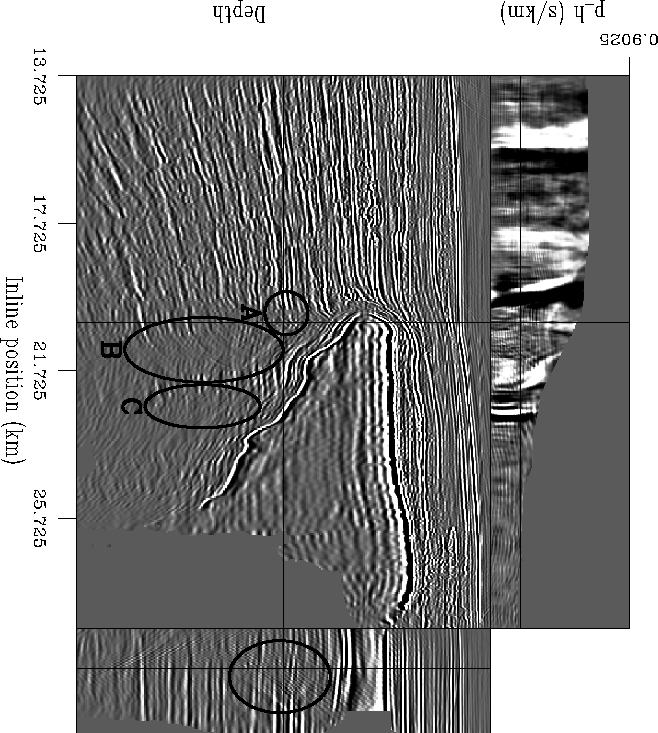
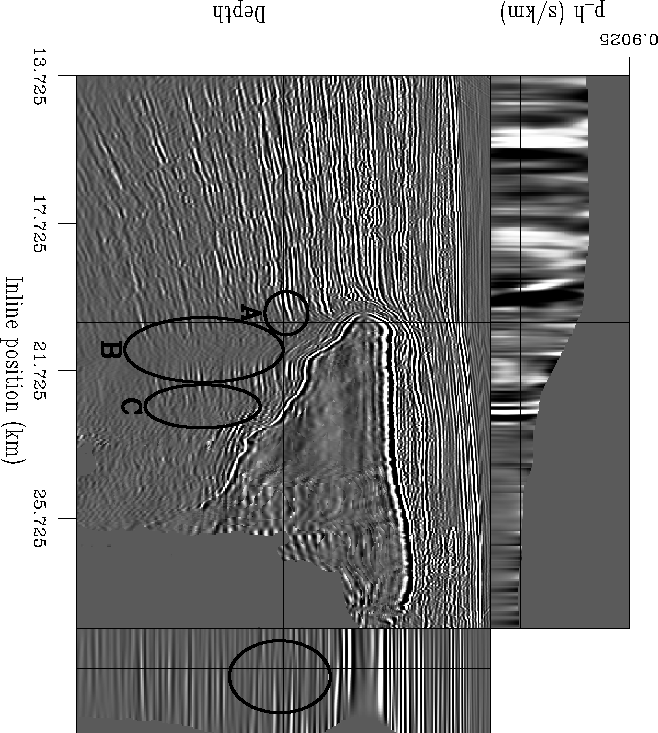
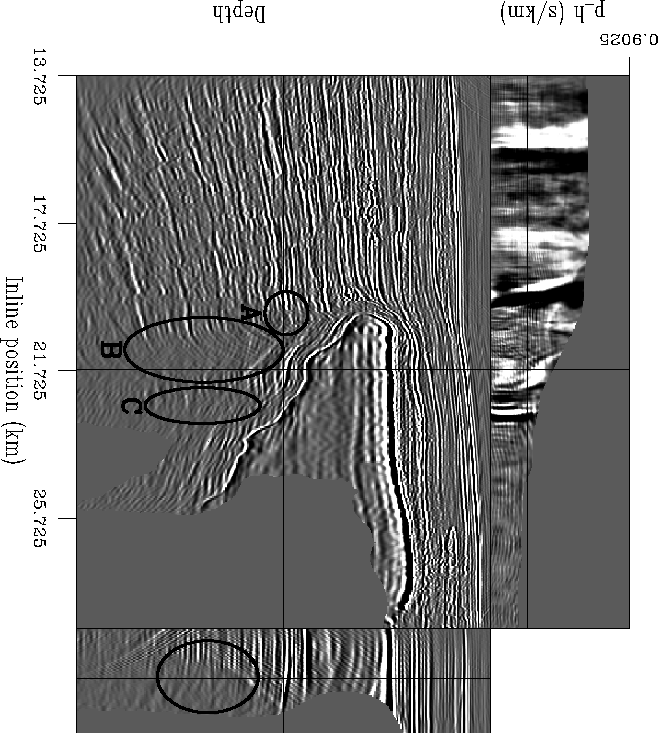
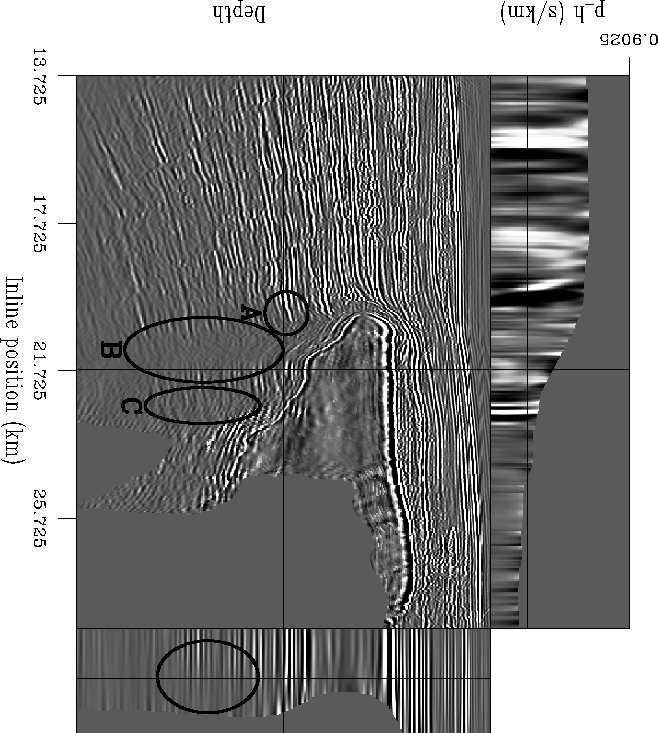
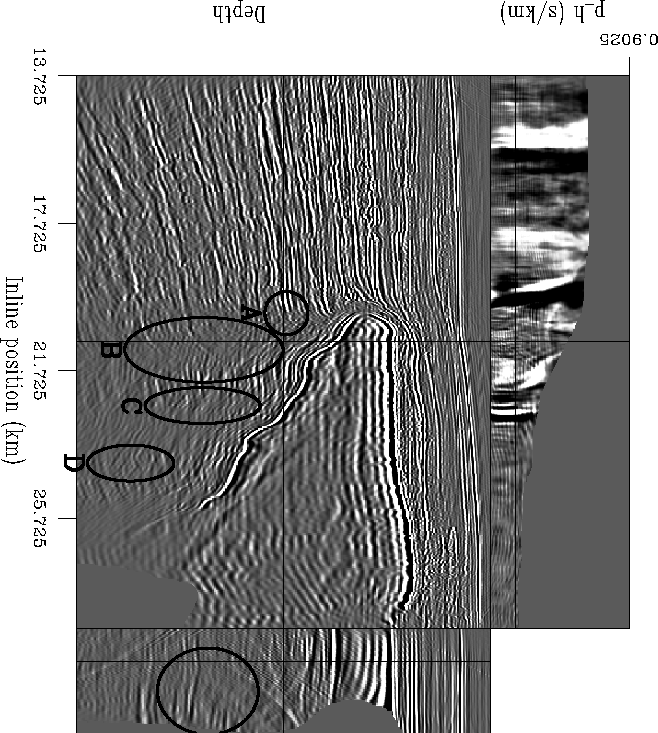
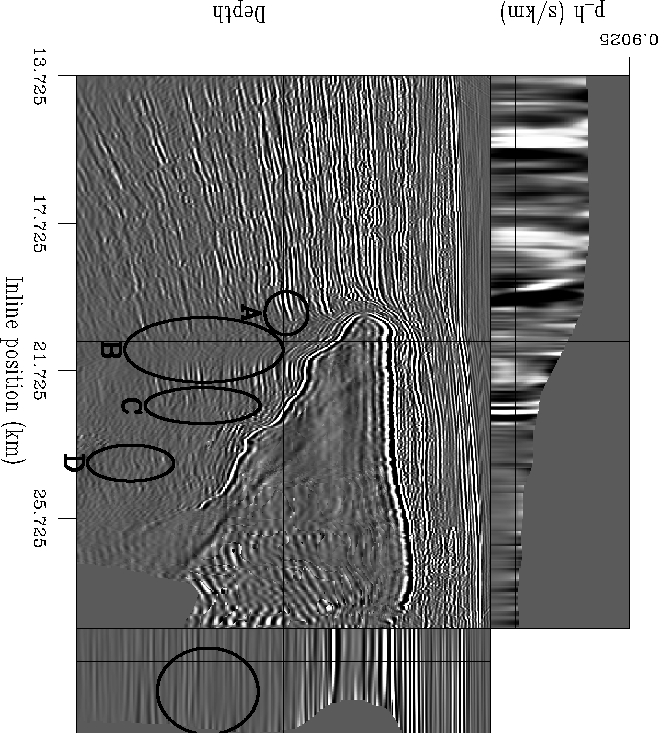
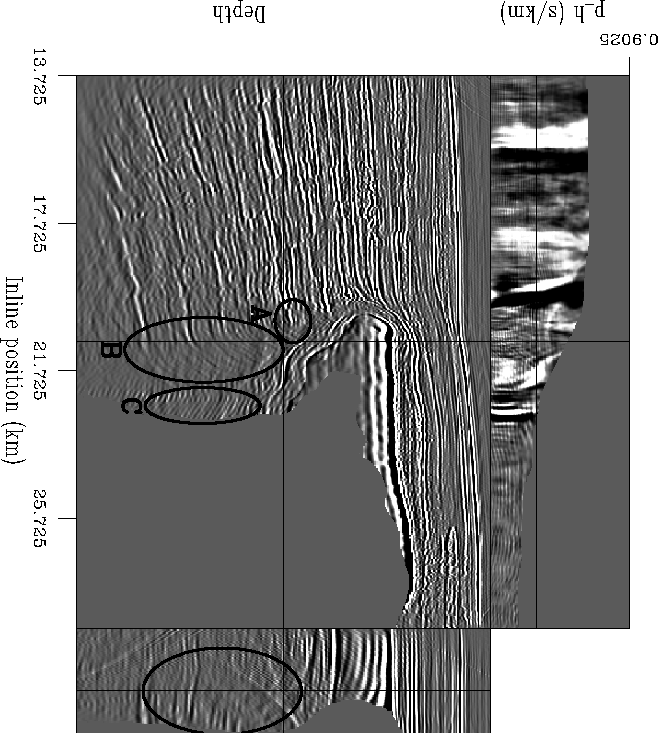
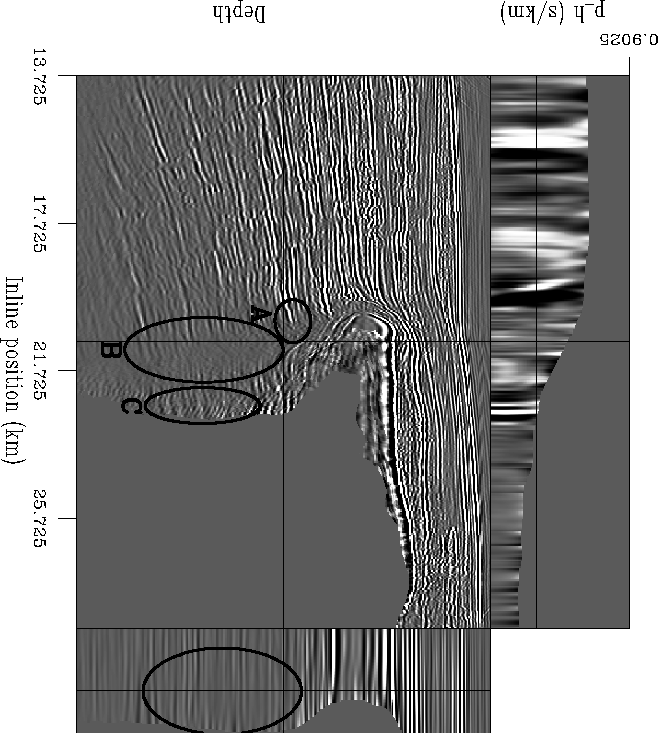
To study these, I have selected several unstacked inline volumes from
crossline=20.9 km. These volumes can be seen in Figures ![[*]](http://sepwww.stanford.edu/latex2html/cross_ref_motif.gif) through
through ![[*]](http://sepwww.stanford.edu/latex2html/cross_ref_motif.gif) , where (if you rotate the pages 90o
clockwise) I am displaying the depth slice on the
top of the figure, the common inline ph section on the left, and the
common image gather to the right of the common inline ph section.
The migration
result is shown first, then the geophysical RIP result for each
(common inline ph section - common image gather) pair.
, where (if you rotate the pages 90o
clockwise) I am displaying the depth slice on the
top of the figure, the common inline ph section on the left, and the
common image gather to the right of the common inline ph section.
The migration
result is shown first, then the geophysical RIP result for each
(common inline ph section - common image gather) pair.
Figures ![[*]](http://sepwww.stanford.edu/latex2html/cross_ref_motif.gif) and
and ![[*]](http://sepwww.stanford.edu/latex2html/cross_ref_motif.gif) show a common
inline ph section from ph=.1875 and a common image gather from
inline position 20.375 km.
Comparing Figure
show a common
inline ph section from ph=.1875 and a common image gather from
inline position 20.375 km.
Comparing Figure ![[*]](http://sepwww.stanford.edu/latex2html/cross_ref_motif.gif) and Figure
and Figure ![[*]](http://sepwww.stanford.edu/latex2html/cross_ref_motif.gif) ,
the RIP result is considerably cleaner. The effects of the regularization
are clear in the common image gather (right part of the figures), where
the unlabeled oval indicates gaps in the events that are filled by RIP. In the
common inline ph section, the ovals indicate particular areas of the
shadow zones that are being filled in. Oval ``A'' highlights a reflector
that is discontinuous and has inconsistent amplitudes where it does
exist in the migration result. In the RIP result, this reflector is
continuous with strong amplitudes along its full extent. Oval ``B''
extends across one of the shadow zones. The shadow zone is considerably
cleaner in the RIP result, with almost none of the up-sweeping artifacts
seen in the migration result. Also, the reflectors themselves extend
farther into the shadow zone, particularly on the right side of the
oval. The events also extend farther into the shadow zone indicated by
oval ``C''.
,
the RIP result is considerably cleaner. The effects of the regularization
are clear in the common image gather (right part of the figures), where
the unlabeled oval indicates gaps in the events that are filled by RIP. In the
common inline ph section, the ovals indicate particular areas of the
shadow zones that are being filled in. Oval ``A'' highlights a reflector
that is discontinuous and has inconsistent amplitudes where it does
exist in the migration result. In the RIP result, this reflector is
continuous with strong amplitudes along its full extent. Oval ``B''
extends across one of the shadow zones. The shadow zone is considerably
cleaner in the RIP result, with almost none of the up-sweeping artifacts
seen in the migration result. Also, the reflectors themselves extend
farther into the shadow zone, particularly on the right side of the
oval. The events also extend farther into the shadow zone indicated by
oval ``C''.
Moving further under the salt and to a larger offset ray parameter,
Figures ![[*]](http://sepwww.stanford.edu/latex2html/cross_ref_motif.gif) and
and ![[*]](http://sepwww.stanford.edu/latex2html/cross_ref_motif.gif) show a common
inline ph section from ph=.2325 and a common image gather from
inline position 21.65 km. The unlabeled oval in the common image
gather shows events that have been strengthen and are more horizontal
in the RIP result (Fig.
show a common
inline ph section from ph=.2325 and a common image gather from
inline position 21.65 km. The unlabeled oval in the common image
gather shows events that have been strengthen and are more horizontal
in the RIP result (Fig. ![[*]](http://sepwww.stanford.edu/latex2html/cross_ref_motif.gif) ) than the migration result
(Fig.
) than the migration result
(Fig. ![[*]](http://sepwww.stanford.edu/latex2html/cross_ref_motif.gif) ). The ovals marked ``A'', ``B'', and ``C''
on the common ph sections show the same type of improvement seen in
the previous comparison (Figs.
). The ovals marked ``A'', ``B'', and ``C''
on the common ph sections show the same type of improvement seen in
the previous comparison (Figs. ![[*]](http://sepwww.stanford.edu/latex2html/cross_ref_motif.gif) and
and ![[*]](http://sepwww.stanford.edu/latex2html/cross_ref_motif.gif) ).
The reflectors at the right side of oval ``B'' in Figure
).
The reflectors at the right side of oval ``B'' in Figure ![[*]](http://sepwww.stanford.edu/latex2html/cross_ref_motif.gif) extend much farther into the shadow zone than those from the migration
result.
extend much farther into the shadow zone than those from the migration
result.
Another interesting comparison can be made at common inline ph section
from ph=.15 and a common image gather from inline position 20.9 km
(Figures ![[*]](http://sepwww.stanford.edu/latex2html/cross_ref_motif.gif) and
and ![[*]](http://sepwww.stanford.edu/latex2html/cross_ref_motif.gif) ). In this
migration result (Fig.
). In this
migration result (Fig. ![[*]](http://sepwww.stanford.edu/latex2html/cross_ref_motif.gif) ), the common image
gather once again has events with gaps caused by poor illumination,
indicated by the unlabeled oval. These gaps are largely filled by 7
iterations of RIP, as seen in Figure
), the common image
gather once again has events with gaps caused by poor illumination,
indicated by the unlabeled oval. These gaps are largely filled by 7
iterations of RIP, as seen in Figure ![[*]](http://sepwww.stanford.edu/latex2html/cross_ref_motif.gif) . We see the
same improvements in ovals ``A'', ``B'', and ``C'' as discussed for the
previous two comparisons. In this comparison, there is an additional
oval ``D'' that indicated reflectors under the salt that are less
affected by artifacts and more likely to be accurate in the RIP result
than in the migration result.
. We see the
same improvements in ovals ``A'', ``B'', and ``C'' as discussed for the
previous two comparisons. In this comparison, there is an additional
oval ``D'' that indicated reflectors under the salt that are less
affected by artifacts and more likely to be accurate in the RIP result
than in the migration result.
Finally, looking at the same common image gather from inline position 20.9 km
but moving the common inline ph section to ph=.2925, we compare
Figures ![[*]](http://sepwww.stanford.edu/latex2html/cross_ref_motif.gif) and
and ![[*]](http://sepwww.stanford.edu/latex2html/cross_ref_motif.gif) .
In this common ph section, the effect of the critical angle and user-defined
mutes described in the previous chapter can be seen in and below the salt
body. The oval in the common image gather shows the same events
with gaps in the migration result (Fig.
.
In this common ph section, the effect of the critical angle and user-defined
mutes described in the previous chapter can be seen in and below the salt
body. The oval in the common image gather shows the same events
with gaps in the migration result (Fig. ![[*]](http://sepwww.stanford.edu/latex2html/cross_ref_motif.gif) ) that are filled
by RIP (Fig.
) that are filled
by RIP (Fig. ![[*]](http://sepwww.stanford.edu/latex2html/cross_ref_motif.gif) ) that was seen in the previous comparison.
It is interesting to see that the improvements seen in the ``A'', ``B'',
and ``C'' ovals in the previous examples are also seen in this example,
at a much larger ph. RIP has a positive effect for
a large range of ph.
) that was seen in the previous comparison.
It is interesting to see that the improvements seen in the ``A'', ``B'',
and ``C'' ovals in the previous examples are also seen in this example,
at a much larger ph. RIP has a positive effect for
a large range of ph.
bp3d.mig.1
Figure 18 Migration result.
Crossline=20.9 km, common inline ph section from ph=.1875,
and common image gather from inline=20.375 km. Compare with
Figure ![[*]](http://sepwww.stanford.edu/latex2html/cross_ref_motif.gif) .
.


 bp3d.geop.1
Figure 19 Geophysical RIP result.
Crossline=20.9 km, common inline ph section from ph=.1875,
and common image gather from inline=20.375 km. Compare with
Figure ![[*]](http://sepwww.stanford.edu/latex2html/cross_ref_motif.gif) .
.


 bp3d.mig.2
Figure 20 Migration result.
Crossline=20.9 km, common inline ph section from ph=.2325,
and common image gather from inline=21.65 km. Compare with
Figure ![[*]](http://sepwww.stanford.edu/latex2html/cross_ref_motif.gif) .
.


 bp3d.geop.2
Figure 21 Geophysical RIP result.
Crossline=20.9 km, common inline ph section from ph=.2325,
and common image gather from inline=21.65 km. Compare with
Figure ![[*]](http://sepwww.stanford.edu/latex2html/cross_ref_motif.gif) .
.


 bp3d.mig.3
Figure 22 Migration result.
Crossline=20.9 km, common inline ph section from ph=.15,
and common image gather from inline=20.9 km. Compare with
Figure ![[*]](http://sepwww.stanford.edu/latex2html/cross_ref_motif.gif) .
.


 bp3d.geop.3
Figure 23 Geophysical RIP result.
Crossline=20.9 km, common inline ph section from ph=.15,
and common image gather from inline= 20.9 km. Compare with
Figure ![[*]](http://sepwww.stanford.edu/latex2html/cross_ref_motif.gif) .
.


 bp3d.mig.4
Figure 24 Migration result.
Crossline=20.9 km, common inline ph section from ph=.2925,
and common image gather from inline=20.9 km. Compare with
Figure ![[*]](http://sepwww.stanford.edu/latex2html/cross_ref_motif.gif) .
.


 bp3d.geop.4
Figure 25 Geophysical RIP result.
Crossline=20.9 km, common inline ph section from ph=.2925,
and common image gather from inline=20.9 km. Compare with
Figure ![[*]](http://sepwww.stanford.edu/latex2html/cross_ref_motif.gif) .
.


Next: Summary
Up: 3-D results
Previous: Comparison of 3-D stacked
Stanford Exploration Project
10/31/2005
![[*]](http://sepwww.stanford.edu/latex2html/cross_ref_motif.gif) through
through ![[*]](http://sepwww.stanford.edu/latex2html/cross_ref_motif.gif) , where (if you rotate the pages 90o
clockwise) I am displaying the depth slice on the
top of the figure, the common inline ph section on the left, and the
common image gather to the right of the common inline ph section.
The migration
result is shown first, then the geophysical RIP result for each
(common inline ph section - common image gather) pair.
, where (if you rotate the pages 90o
clockwise) I am displaying the depth slice on the
top of the figure, the common inline ph section on the left, and the
common image gather to the right of the common inline ph section.
The migration
result is shown first, then the geophysical RIP result for each
(common inline ph section - common image gather) pair.
