 |
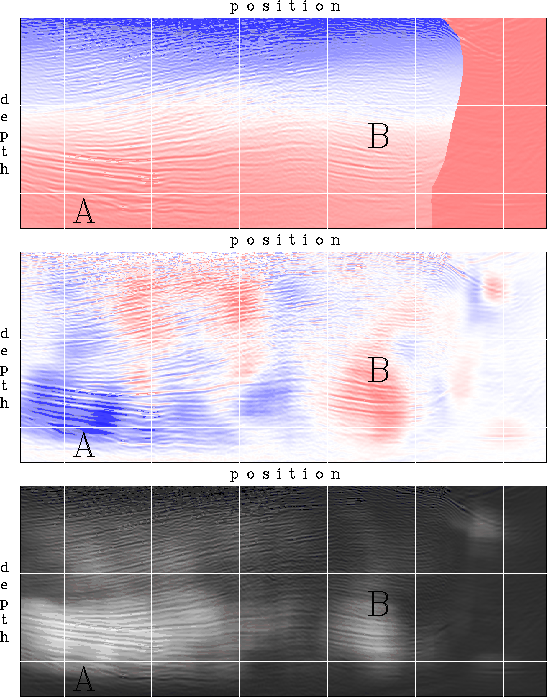
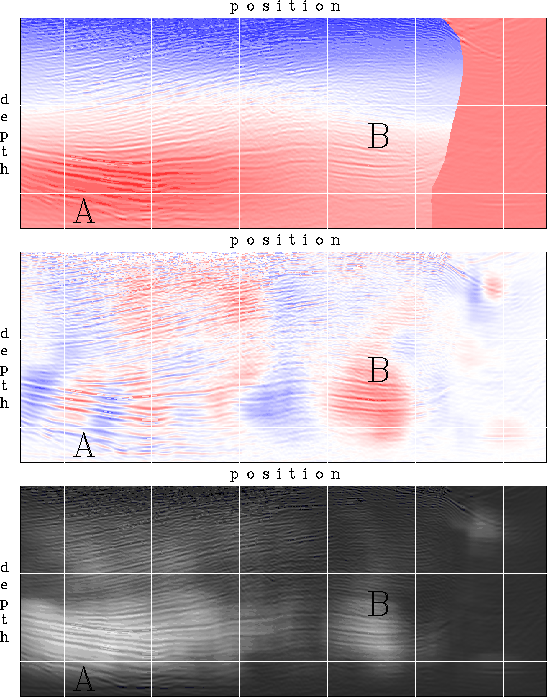
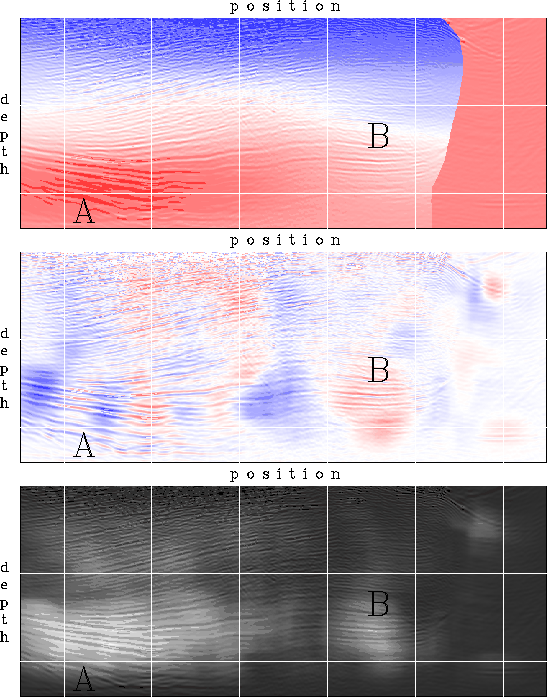
Figure 16 Gulf of Mexico data. Migrated image superimposed on slowness (top), residual migration picks (middle), and picking weight (bottom). The migration corresponds to the background slowness.
BPGOM.it0 (top) shows the image migrated with the background velocity superimposed on the background slowness. This image serves as a reference against which I check the results of the velocity analysis. Two regions of interest are labeled A and B in the figure. The right edge of the model corresponds to a salt body. The top edge of the image is not at the surface, because I have datumed the surface data to a depth below the well-imaged overhanging salt body.
As for the preceding example, I run residual migration and analyze the moveouts of ADCIGs. BPGOM.srm shows this analysis at one location in the left part of the model. The left panel shows this ADCIG changing according to the velocity ratio parameter, while the right panel shows the semblance scan corresponding to each of these ratios. The overlain line is a pick of maximum semblance, indicating the flattest ADCIG at every depth level. This analysis is repeated at every location from which I obtain two maps: a map of the residual migration parameter at every location in the image (BPGOM.it0, middle), and a map of the weight indicating the reliability of the picks (BPGOM.it0, bottom). The residual migration parameter is plotted relative to 1 (indicated in white), therefore the whiter the map, the flatter the ADCIGs. Overlain is the stack of the background images for visual identification of image features. Next, I generate an image perturbation based on the residual migration picks in BPGOM.it0 (middle) and invert for slowness perturbation using the weights in BPGOM.it0 (bottom) as an approximation for the inverse data covariance matrix.
The results obtained after two non-linear iterations of WEMVA are shown in BPGOM.it1 and BPGOM.it2. As for BPGOM.it0, the three panels show the migrated image superimposed on slowness (top), residual migration picks (middle), and pick weights (bottom). Two regions in which changes occur are labeled A and B.
For both iterations 1 and 2, the residual migration picks converge toward 1, indicating flatter ADCIGs, therefore better focused images. Reflectors in both regions shift vertically, according to the slowness changes. A notable feature is the improved continuity of the strongest reflectors in the region labeled B.
Both image improve after migration with the updated slownesses from WEMVA. However, there are regions where the image changes are small, if at all present. For example, the region to the left of ``B'', which corresponds to a shadow zone caused by the salt structure in the upper part of the model, does not change. Better velocity could be estimated in this region with 3D data, since the shadow zones have three-dimensional expressions.
 |
 |
 |
 |