

Next: Sigsbee 2A synthetic model
Up: Examples
Previous: Simple WEMVA example
Depth imaging of complex structures
depends on the quality of the velocity model.
However, conventional Migration Velocity Analysis (MVA)
procedures often fail when
the wavefield exhibits complex multi-pathing
caused by strong lateral velocity variations.
Imaging under rugged salt bodies
is an important case
when ray-based MVA methods are not reliable.
In wemva, I introduce
the theory and methodology
of an MVA procedure based on wavefield extrapolation
with the potential of overcoming
the limitations of ray-based MVA methods.
In this section, I present the application of the
proposed procedure to Sigsbee 2A,
a realistic and challenging
2D synthetic data set created by the SMAART JV
(70), and to a 2D line of a 3D
real dataset from the Gulf of Mexico.
Many factors determine
the failure of ray-based MVA in a sub-salt
environment.
Some of them are successfully
addressed by the wave-equation MVA (WEMVA) method,
whereas others, for example
the problems that are caused by essential limitations
of the recorded reflection data,
are only partially solved by WEMVA.
An important practical difficulty encountered when
using rays to estimate
velocity below rugose salt bodies
is the instability of ray tracing.
Rough salt topology creates
poorly illuminated areas, or even shadow zones, in
the subsalt region.
The spatial distribution of
these poorly illuminated areas is very sensitive
to the velocity function.
Therefore,
it is often extremely difficult to trace rays
connecting a given point in the poorly
illuminated areas with a given point at the surface
(two-point ray-tracing).
Wavefield extrapolation methods are robust
with respect to shadow zones and they always provide
wavepaths usable for velocity inversion.
A related and more fundamental problem with ray-based
MVA, is that rays poorly approximate
actual wavepaths when a band-limited
seismic wave propagates through a rugose
top of the salt.
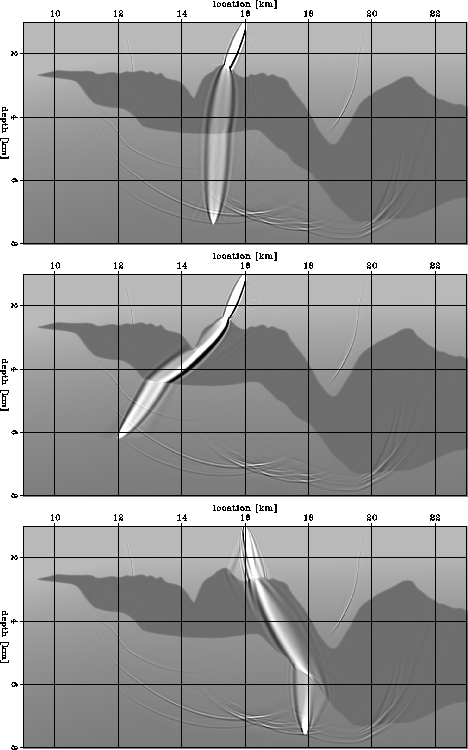
zifat illustrates this issue
by showing three band-limited (1-26 Hz) wavepaths,
also known in in the literature as fat rays or sensitivity kernels
(114; 28; 72).
Each of these three wavepaths
is associated with the same point source located at the surface
but corresponds to a different sub-salt ``event''.
The top panel in zifat shows a wavepath
that could be reasonably
approximated using the method introduced by
(57) to trace fat rays using
asymptotic methods.
In contrast,
the wavepaths shown in both
the middle and bottom panels in
zifat cannot be well approximated using Lomax' method.
The amplitude and shapes of these wavepaths are significantly more complex
than a simple fattening of a geometrical ray could ever describe.
The bottom panel illustrates the worst-case-scenario
situation for ray-based tomography
because the variability of the top salt
topology is at the same scale as the spatial wavelength of the seismic wave.
The fundamental reason why true wavepaths cannot be approximated
using fattened geometrical ray is that
they are frequency dependent.
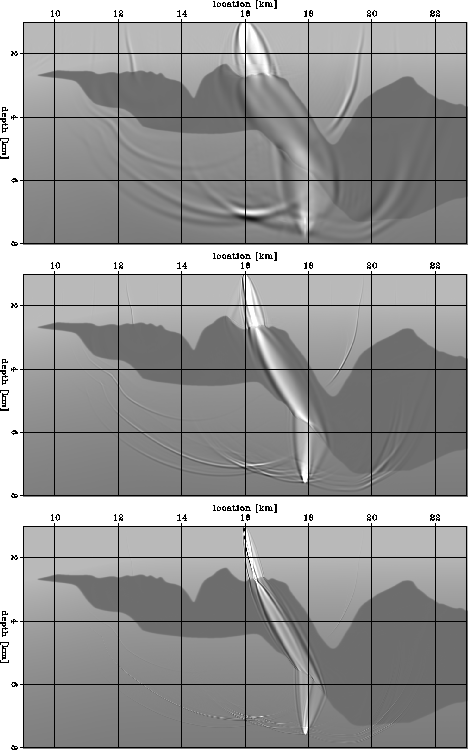
zifrq2 illustrates this dependency
by depicting the wavepath shown in the bottom panel of
zifat as a function
of the temporal bandwidth:
1-5 Hz (top), 1-16 Hz (middle), and
1-64 Hz (bottom).
The width of the wavepath decreases
as the frequency bandwidth increases,
and the focusing/defocussing of
energy varies with the frequency bandwidth.
The limited and uneven ``illumination'' of both the
reflectivity model and the velocity model in
the subsalt region is a challenging problem for
both WEMVA and conventional ray-based MVA
(see SIG.imgC for an example of this problem).
For the reflectors under salt,
the angular bandwidth is drastically reduced
in the angle-domain common image gathers (adcig).
This phenomenon is caused by a lack of oblique wavepaths in the subsalt,
which deteriorates the ``sampling''
of the velocity variations in the subsalt.
Consequently, the velocity inversion
is more poorly constrained in the subsalt sediments
than in the sediments on the side of the salt body.
Uneven illumination of subsalt reflectors is
even more of a challenge than reduced angular coverage.
It makes the velocity information present in the ADCIGs
less reliable by causing discontinuities in the reflection events
and creating artifacts.
MVA methods assume that
when the migration velocity is correct,
events are flat in ADCIGs along the aperture-angle axis.
Velocity updates are estimated by minimizing curvature of
events in ADCIGs.
MVA methods may provide biased estimates
where uneven illumination creates events
that are bending along the aperture-angle axis,
even where the image is created with correct velocity.
I address this issue by weighting
the image perturbations before inverting
them into velocity perturbations, as described in wemva.
The weights are function of the ``reliability''
of the moveout measurements in the ADCIGs.
zifat
Figure 4 Kinematic sensitivity kernels for frequencies between 1 and 26 Hz
for various locations in the image and a
point on the surface.
Each panel is an overlay of three elements:
the slowness model, the wavefield corresponding
to a point source on the surface at x=16 km, and
wavepaths (sensitivity kernels) from a point in the subsurface to the
source.


 zifrq2
Figure 5 Frequency dependence of kinematic sensitivity kernels between a
location in the image and a point on the surface.
Each panel is an overlay of three elements:
the slowness model, the wavefield corresponding
to a point source on the surface at x=16 km, and
wavepaths (sensitivity kernels) from a point in the subsurface to the
source.
The different wavepaths correspond to frequency bands of
1-5 Hz (top),
1-16 Hz (middle) and
1-64 Hz (bottom).
The larger the frequency band, the narrower the wavepath.
The end member for an infinitely wide frequency band
corresponds to an infinitely thin geometrical ray.


I demonstrate the WEMVA method using synthetic and real datasets
corresponding to subsalt environments.

