Next: 3D field data example
Up: 2D field data example
Previous: 2D field data example
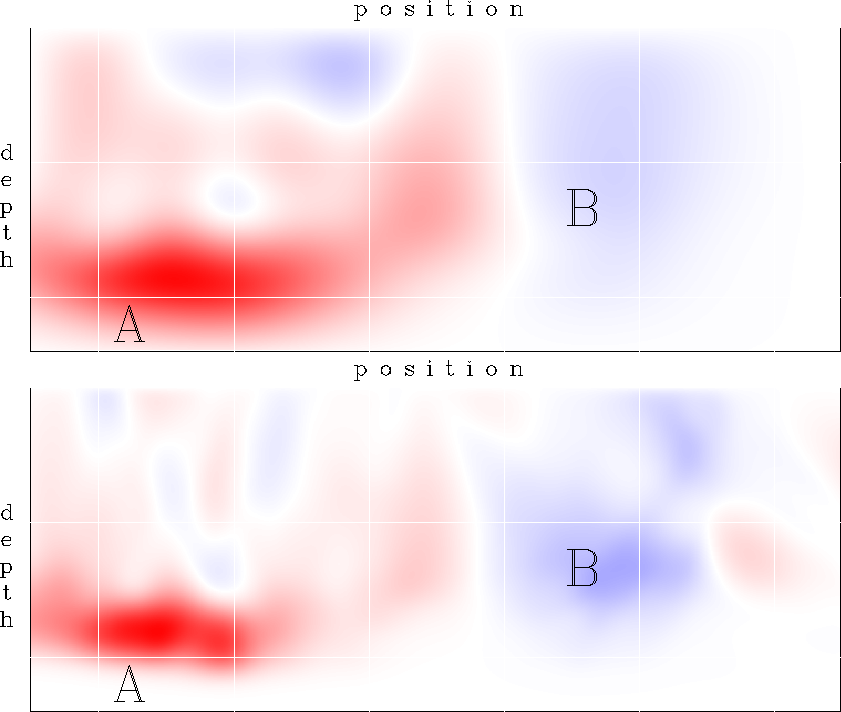
BPGOM.zpc.dsl shows a comparison of
normal incidence with prestack wave-equation MVA.
The top panel corresponds to normal incidence WEMVA,
and the bottom panel corresponds to prestack WEMVA.
The general shape of the velocity anomaly is similar,
although the vertical resolution of prestack WEMVA is
significantly higher. This is a direct result of the
increased angular coverage with wavepaths away from the
vertical.
BPGOM.zpc.dsl
Figure 20
A comparison of normal incidence WEMVA (top panel)
with prestack WEMVA (bottom panel).
Prestack inversion produces anomalies with higher
vertical resolution, due to the increased angular
coverage.


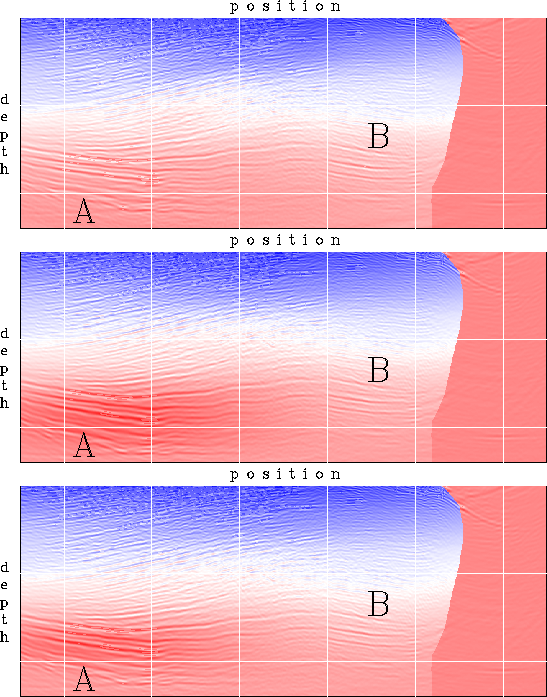
BPGOM.zpc shows a comparison of three images
superimposed on their corresponding velocity model.
From top to bottom, the background velocity,
the velocity updated by normal incidence WEMVA, and
the velocity updated by prestack WEMVA.
The updated images have similar characteristics,
since the velocity updates are also similar, except
for the higher resolution of the prestack inversion.
The lesson we can draw from this example is that
normal incidence WEMVA is a cheap and convenient
alternative to prestack WEMVA, at least for the
cases of smooth velocity anomalies. However, if we seek
higher vertical resolution, we need to use prestack WEMVA.
BPGOM.zpc
Figure 21
Image and velocity comparison for various types of velocity
updates in WEMVA. From top to bottom,
the image created with the background velocity (top),
the image created with the velocity updated with
normal incidence WEMVA (middle), and
the image created with the velocity updated with
prestack WEMVA (bottom).
Next: 3D field data example
Up: 2D field data example
Previous: 2D field data example
Stanford Exploration Project
11/4/2004