Including causality and viscosity in the definition of
R=ikz (equation 12) it is possible to preserve
the energy content for any arbitrary ![]() value.
value.
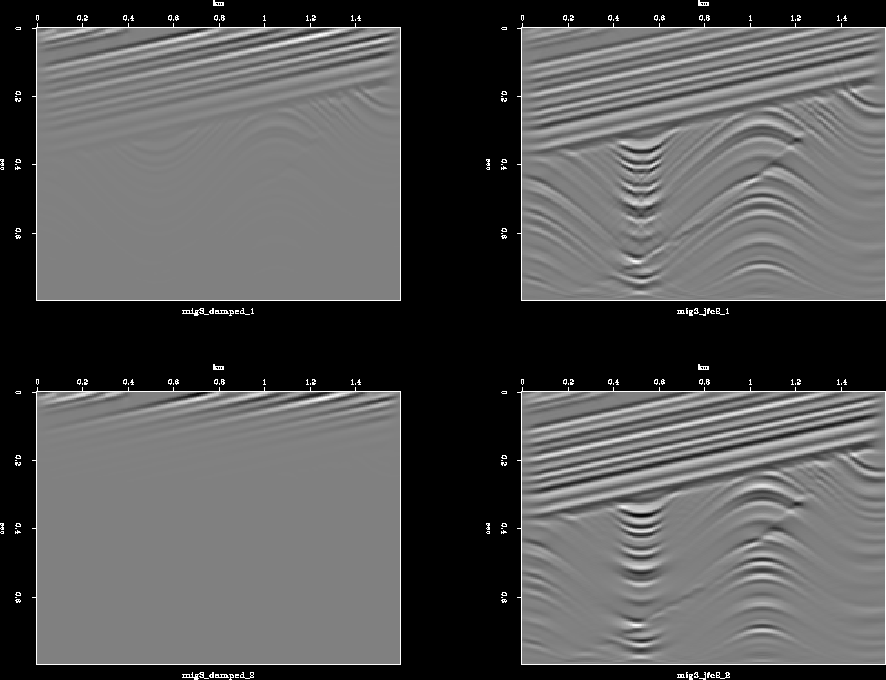
Figure 7 presents the modeling-migration results, using
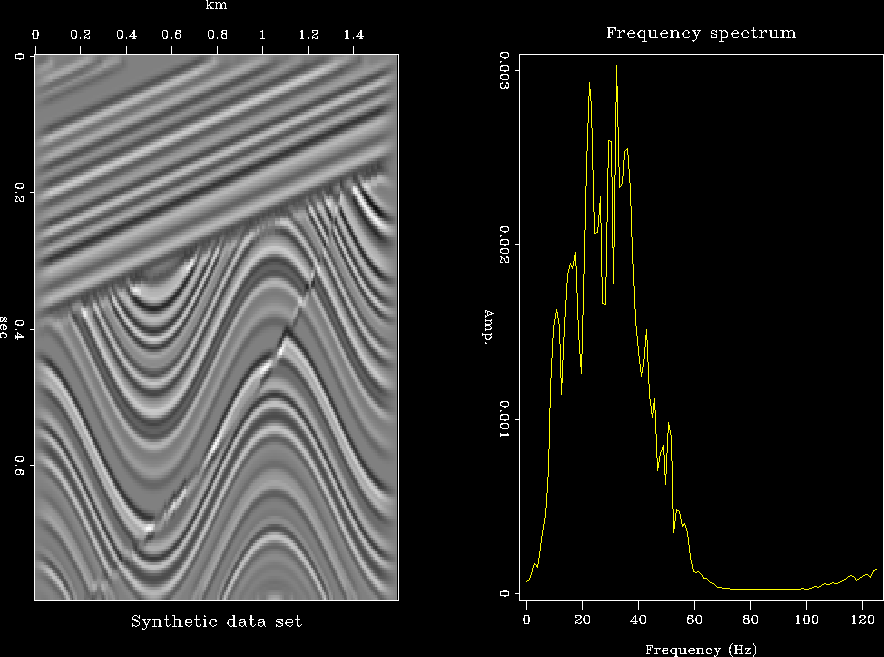
the model of synthetic data set in Figure 6,
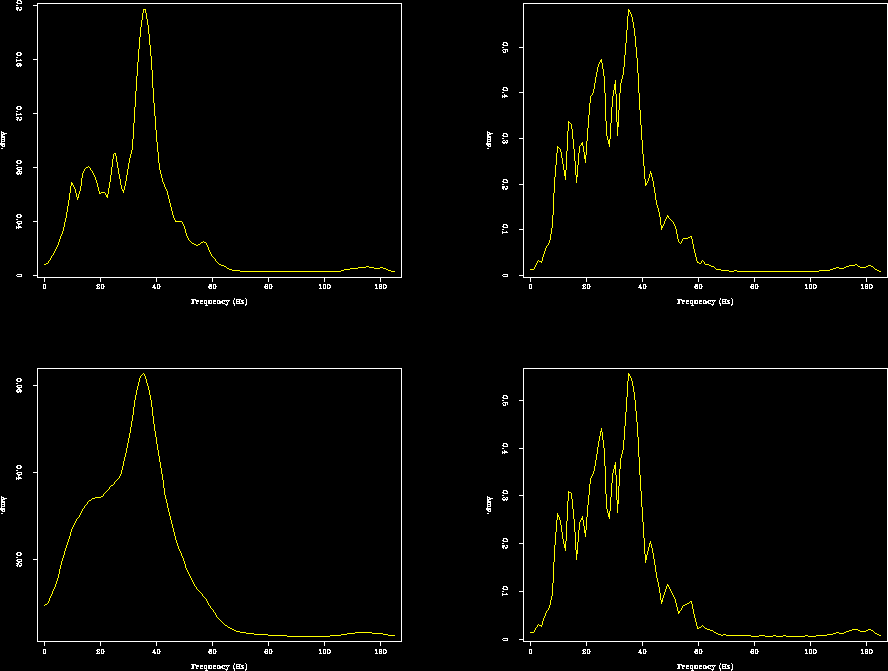
with equations (2) and (12) for two different values of ![]() .Figure 8 shows the respective frequency spectrum.
.Figure 8 shows the respective frequency spectrum.
 |
 |
 |
We can assure the stability of the R definition presented
in equation (12) based on the results of Figures 7 and
8; besides, this R definition is valid
for all values of ![]() and kx.
and kx.
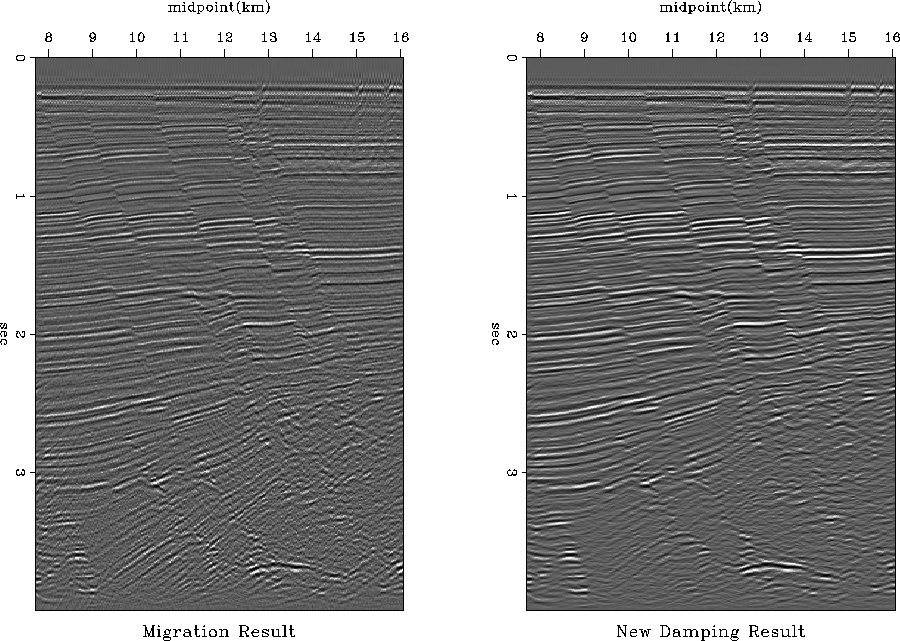
We also perform the phase-shift migration over a real data set, we present the results on Figures 9 and 10. These results show a comparison between phase-shift migration without considering the damping factor [R definition in equation (1)] and considering the damping factor [R definition in equation (12)].
 |
![[*]](http://sepwww.stanford.edu/latex2html/movie.gif)
 |
![[*]](http://sepwww.stanford.edu/latex2html/movie.gif)
The image that we obtain with the damping factor is much cleaner than the image without the damping factor; therefore, the events definition and the faults are more clear.