Next: Interpolation and convolution
Up: Forward Interpolation
Previous: Forward Interpolation
The two simplest forms of the forward interpolation operators are the
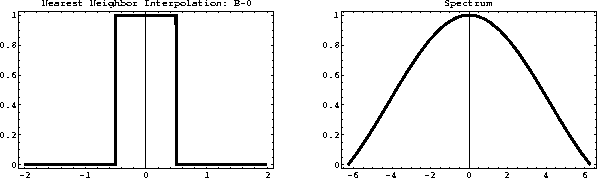
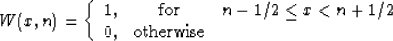
1-point nearest neighbor interpolation with the weight
|  |
(2) |
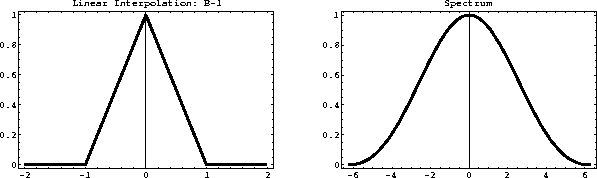
and the 2-point linear interpolation with the weight
|  |
(3) |
Because of their simplicity, the nearest neighbor and linear
interpolation methods are very practical and easy to apply. Their
accuracy is, however, limited and may be inadequate for
interpolating high-frequency signals. The shapes of
interpolants (2) and (3) and their spectra are
plotted in Figures ![[*]](http://sepwww.stanford.edu/latex2html/cross_ref_motif.gif) and . The spectra
plots show that both interpolants act as low-pass filters, preventing
the high-frequency energy from being correctly interpolated.
nnint
and . The spectra
plots show that both interpolants act as low-pass filters, preventing
the high-frequency energy from being correctly interpolated.
nnint
Figure 1 Nearest neighbor interpolant (left) and its spectrum
(right).


 linint
Figure 2 Linear interpolant (left) and its spectrum
(right).
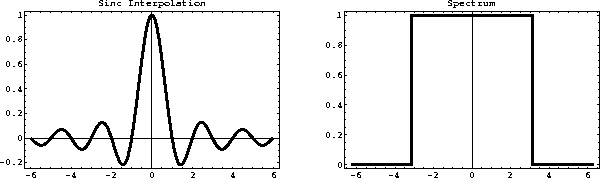
On the other side of the accuracy scale, there is the infinitely long
sinc interpolant:
| ![\begin{displaymath}
W (x, n) = \frac{\sin \left[\pi (x - n) \right]}{\pi (x - n)} \;.\end{displaymath}](img4.gif) |
(4) |
According to the sampling theorem Kotel'nikov (1933); Shannon (1949),
equation (4) provides an optimal interpolation for any
band-limited signal. In practice, it is not directly applicable
because of a prohibitively expensive computation. The shape of the sinc
function and its spectrum are shown in Figure . The
spectrum is identically equal to one in the Nyquist frequency band.
sincint
Figure 3 Sinc interpolant (left) and its spectrum
(right).
Several approaches exist for extending the nearest neighbor and linear
interpolation to more accurate (albeit more expensive) methods. One
example is the 4-point cubic convolution suggested by Keys (1981).
The cubic convolution interpolant is a local piece-wise cubic
function, which approximates the ideal sinc equation (4).
Another popular approach is to taper the ideal sinc function in a
local window. For example, one can use the Kaiser window Kaiser and Shafer (1980)
|  |
(5) |
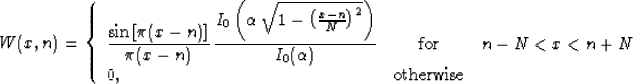
where I0 is the zero-order modified Bessel function of the first
kind. The Kaiser-windowed sinc interpolant (5) has the
adjustable parameter  , which controls the behavior of its
spectrum. I have found empirically the value of
, which controls the behavior of its
spectrum. I have found empirically the value of  to provide
a spectrum that deviates from 1 by no more than 1% in a relatively
wide band.
to provide
a spectrum that deviates from 1 by no more than 1% in a relatively
wide band.
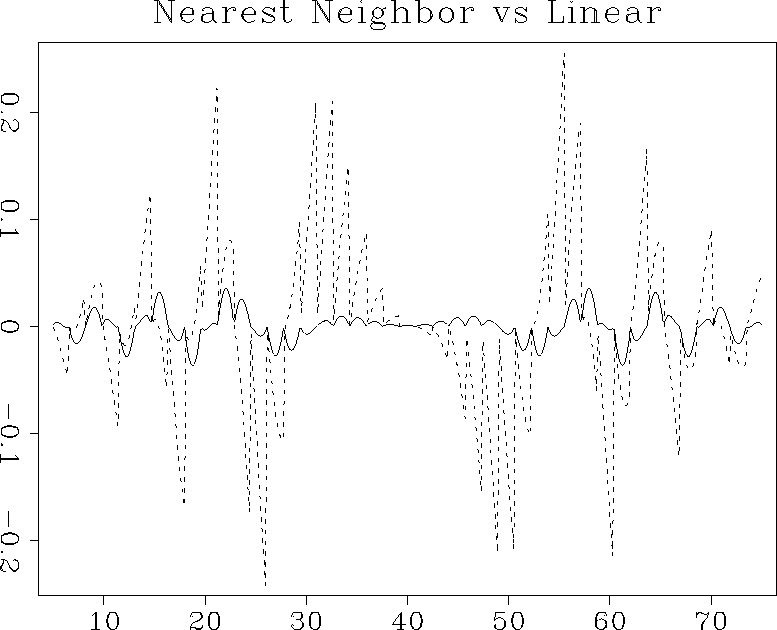
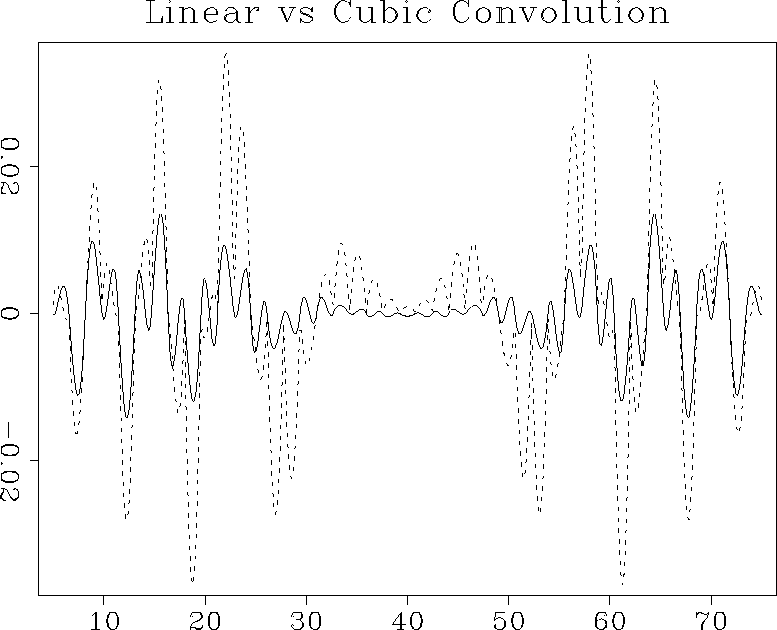
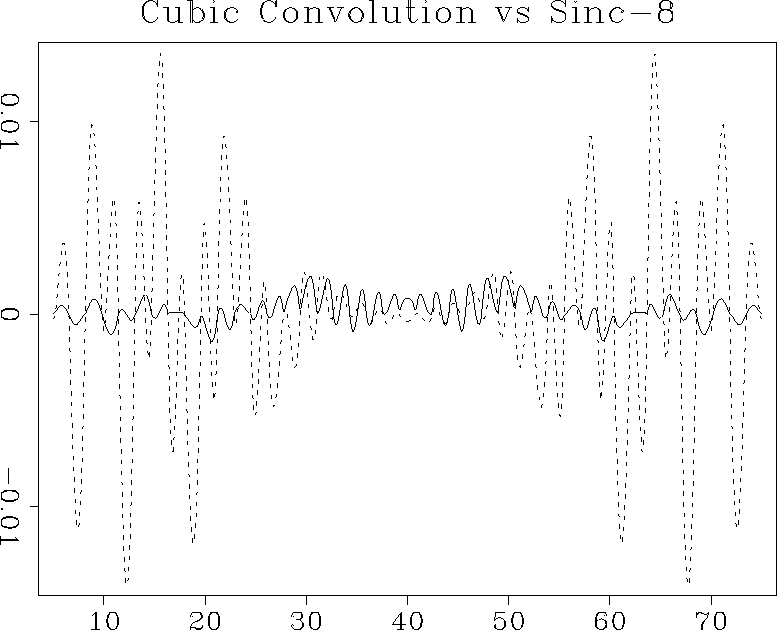
I compare the accuracy of different forward interpolation methods on a
one-dimensional signal shown in Figure . The ideal
signal has an exponential amplitude decay and a quadratic frequency
increase from the center towards the edges. It is sampled at a regular
50-point grid and interpolated to 500 regularly sampled locations. The
interpolation result is compared with the ideal one. Observing
Figures , , and , we
can see the interpolation error steadily decreasing as we go
subsequently from 1-point nearest neighbor to 2-point linear, 4-point
cubic convolution, and 8-point windowed sinc interpolation. At the
same time, the cost of interpolation grows proportionally to the
interpolant length.
chirp
Figure 4 One-dimensional test signal. Top:
ideal. Bottom: sampled at 50 regularly spaced points. The bottom
plot is the input in a forward interpolation test.
|
|  |
binlin
Figure 5 Interpolation error of the nearest
neighbor interpolant (dashed line) compared to that of the linear
interpolant (solid line).
|
|  |
lincub
Figure 6 Interpolation error of the linear
interpolant (dashed line) compared to that of the cubic convolution
interpolant (solid line).
|
|  |
cubkai
Figure 7 Interpolation error of the cubic
convolution interpolant (dashed line) compared to that of the
8-point windowed sinc interpolant (solid line).
|
|  |
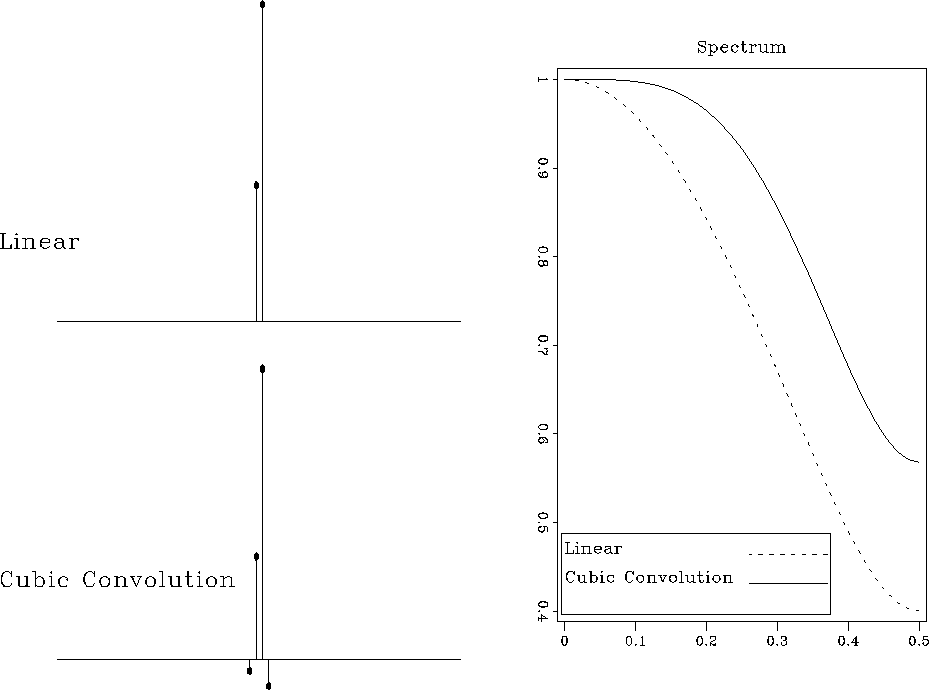
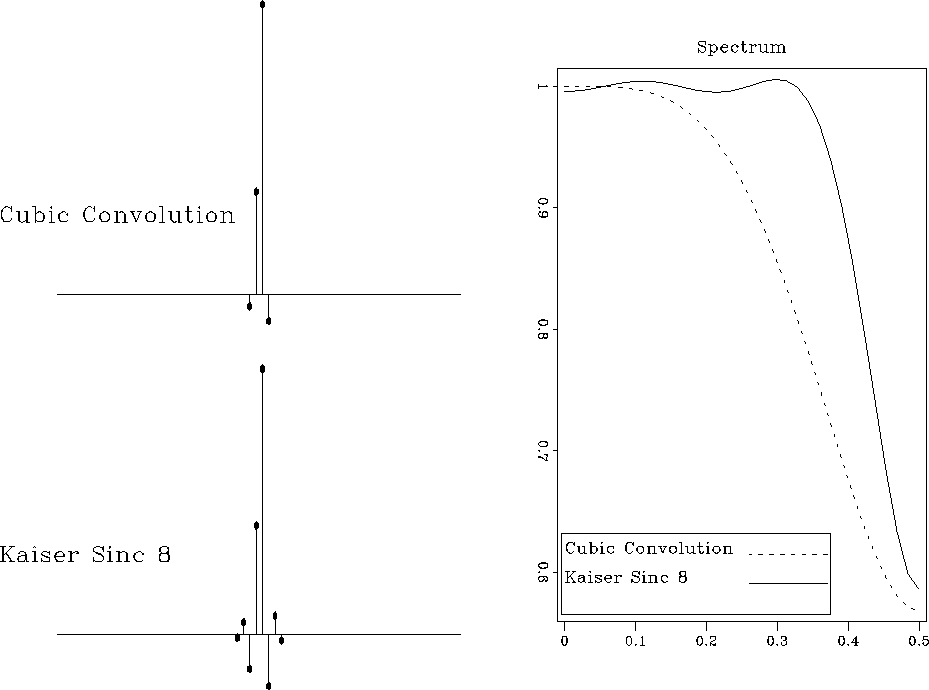
The differences among different methods are also clearly visible from
the discrete spectra of the corresponding interpolants. The left plots
in figures and show discrete
interpolation responses: the function W(x,n) for a fixed value of
x=0.7. The right plots compare the corresponding discrete spectra. We
can see that the spectrum gets flatter and wider as the accuracy of
the method increases.
speclincub
Figure 8 Discrete interpolation responses of
linear and cubic convolution interpolants (left) and their
discrete spectra (right) for x=0.7.
|
|  |
speccubkai
Figure 9 Discrete interpolation responses
of cubic convolution and 8-point windowed sinc interpolants (left)
and their discrete spectra (right) for x=0.7.
|
|  |
Next: Interpolation and convolution
Up: Forward Interpolation
Previous: Forward Interpolation
Stanford Exploration Project
11/9/2000