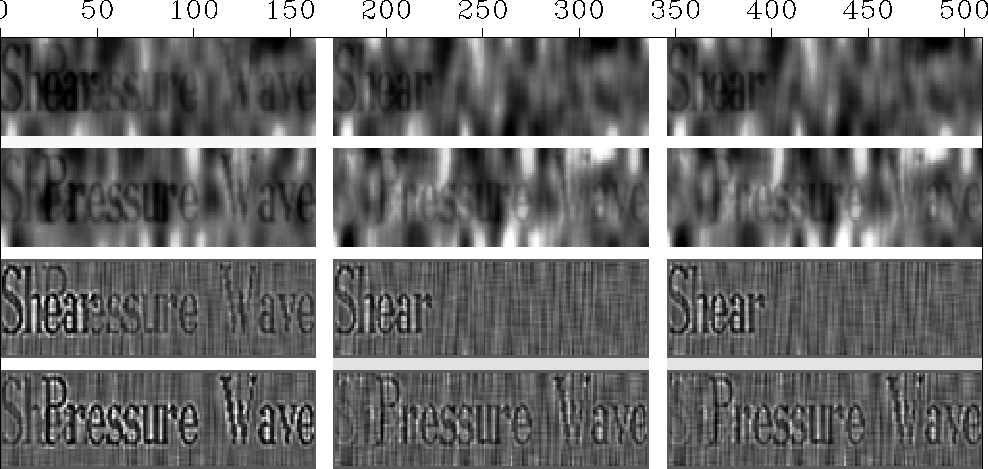
Since we humans can do a better job than the mathematical formulation leading up to Figure 3, we naturally want to consider how to reformulate our mathematics to make it work better. Apparently, our eyes sense the difference between the spatial spectra of the signals and the noise. Visually, we can suppress the noise because of its noticeably lower frequency. This suggests filtering the data to suppress the noise.
On the filtered data with the noise suppressed,
we can estimate the crosstalk parameter ![]() .Of course, filtering the noise will filter the signal too,
but we need not display the filtered data,
only use it to estimate
.Of course, filtering the noise will filter the signal too,
but we need not display the filtered data,
only use it to estimate ![]() .That estimated
.That estimated ![]() is applied to the raw (unfiltered) data
and presented as ``the answer.''
is applied to the raw (unfiltered) data
and presented as ``the answer.''
Of course, we may as well display both filtered and unfiltered data and label them accordingly. We might prefer unfiltered noisy images or we might prefer filtered images with less noise. Seismograms present a similar problem. Some people think they prefer to look at a best image of the earth's true velocity, impedance, or whatever, while others prefer to look at a filtered version of the same, especially if the filter is known and the image is clearer.
Here I chose a simple filter to suppress the low-frequency noise.
It may be far from optimal.
(What actually is optimal is a question addressed
in chapters ![[*]](http://sepwww.stanford.edu/latex2html/cross_ref_motif.gif) and
and ![[*]](http://sepwww.stanford.edu/latex2html/cross_ref_motif.gif) .)
For simplicity, I chose to apply the Laplacian operator
.)
For simplicity, I chose to apply the Laplacian operator
![]() to the images to roughen them,
i.e., to make them less predictable.
The result is shown in Figure 4.
to the images to roughen them,
i.e., to make them less predictable.
The result is shown in Figure 4.
 |
The bottom rows are the roughened images.
On the left is the input data.
Although the crosstalk is visible
on both the raw images and the filtered images,
it seems more clearly visible on the filtered images.
``Visibility'' is not the sole criterion here because
the human eye can be an effective filter device too.
There can be no doubt that the crosstalk has larger amplitude
(above the background noise) on the filtered images.
This larger amplitude is what is important in the dot-product
definition of ![]() .So the bottom panels of filtered data are used to compute
.So the bottom panels of filtered data are used to compute
![]() , and the top panels are computed from that
, and the top panels are computed from that ![]() .Finally, notice that the unfiltered data looks
somewhat worse after crosstalk removal.
This is because the combination
of
.Finally, notice that the unfiltered data looks
somewhat worse after crosstalk removal.
This is because the combination
of ![]() and
and ![]() contains noise from each.
contains noise from each.