Next: About this document ...
Up: CORRELATION AND SPECTRA
Previous: Crosscorrelation
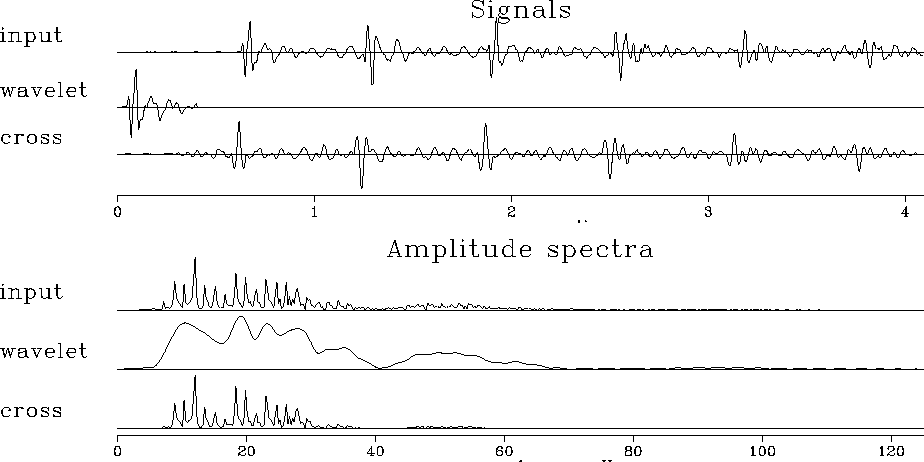
Figure 13 shows a
deep-water seismogram
where the bottom is unusually hard.
The second signal is the wavelet that results from
windowing about the first water-bottom reflection.
Notice that the wavelet has a comparatively simple spectrum,
its principal feature being that it vanishes at low frequencies
and high frequencies.
The input has a spectrum that is like that of the wavelet,
but multiplied by a fine-toothed comb
reminiscent of ``cmb5'' in Figure 12.
match
Figure 13
Example of matched filtering with water-bottom reflection.
Top shows signals and bottom shows corresponding spectra.
The result was time shifted to best align with the input.


``Matched filtering''
is crosscorrelating with a wavelet.
Equivalently, it is convolving with the time-reversed wavelet.
Matched filtering uses Y(Z)=F(1/Z)X(Z)
instead of Y(Z)=F(Z)X(Z).
The third signal in Figure 13
shows the data crosscorrelated with the sea-floor reflection.
Notice that the output sea-floor reflection is symmetric
like an autocorrelation
function.
Later bounces are
crosscorrelations,
but they resemble the autocorrelation.
Ideally, alternate water-bottom reflections have alternating
polarities.
From the figure you can see that matched filtering makes this idealization
more apparent.
An annoying feature of the matched filter is that it is
noncausal, i.e., there is an output before there is an input.
You can see this in Figure 13
just before the water-bottom reflection.
EXERCISES:
-
Suppose a wavelet is made up of complex numbers.
Is the autocorrelation relation sk = s-k true?
Is sk real or complex? Is
 real or complex?
-
If concepts of time and frequency are interchanged, what does
the meaning of spectrum become?
-
Suggest a reason why the spectrum of the wavelet
in Figure 13 contains more low-frequency energy than
the whole seismogram.
-
Suggest a reason why the spectrum of the wavelet
in Figure 13 contains more high-frequency energy than
the whole seismogram.
Next: About this document ...
Up: CORRELATION AND SPECTRA
Previous: Crosscorrelation
Stanford Exploration Project
10/21/1998