 |
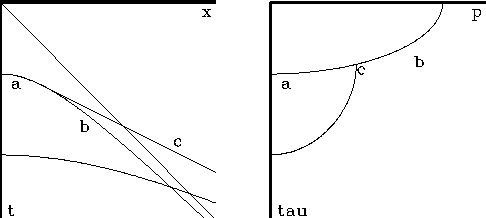
Figure 7 Identification of precritical reflection (a), postcritical reflection (b), and head wave (c).
Figure 7 shows the travel times of waves in a two-layer model.
 |
As is the usual case, the velocity is higher in the deeper layer. At the left are the familiar hyperboloidal curves. Strictly, the top curve is exactly a hyperbola whereas the lower curve is merely hyperboloidal. The straight line through the origin represents energy traveling horizontally along the earth's surface. The lower straight line is the head wave. (In seismology it is often called the refracted wave, but this name can cause confusion). It represents a ray that hits the deeper layer at critical angle and then propagates horizontally along the interface.
The right side of the figure shows the travel-time curves after slant stacking.
Note that curves cross one another in the (x,t)-space
but they do not cross one another in the ![]() -space.
The horizontal axis p=dt/dx has physical dimensions
inverse to velocity.
Indeed, the velocity of each layer may be read from its travel-time curve
as the maximum p-value on its ellipse.
The head waves--which are straight lines in (x,t)-space--are points
in
-space.
The horizontal axis p=dt/dx has physical dimensions
inverse to velocity.
Indeed, the velocity of each layer may be read from its travel-time curve
as the maximum p-value on its ellipse.
The head waves--which are straight lines in (x,t)-space--are points
in ![]() -space located where the ellipsoids touch.
The top curve in
-space located where the ellipsoids touch.
The top curve in ![]() -space is exactly an ellipse,
and the lower curve is merely ellipsoidal.
-space is exactly an ellipse,
and the lower curve is merely ellipsoidal.