On most computers the Stolt [1978] method of migration is the fastest one--by a wide margin. For many applications, this will be its most important attribute. For a constant-velocity earth it incorporates the Huygens wave source exactly correctly. Like the other methods, this migration method can be reversed and made into a modeling program. One drawback, a matter of principle, is that the Stolt method does not handle depth variation in velocity. This drawback is largely offset in practice by an approximate correction that uses an axis-stretching procedure. A practical problem is the periodicity of all the Fourier transforms. In principle this is no problem at all, since it can be solved by adequately surrounding the data by zeroes.
A single line sketch of the Stolt method is this:
![]()
To see why this works, begin with the input-output relation for downward extrapolation of wavefields:
| |
(22) |
| (23) |
| |
(24) |
Equation (24) gives the final image, but it is in an unattractive form, since it implies that a two-dimensional integration must be done for each and every z-level. The Stolt procedure converts the three-dimensional calculation thus implied by (24) to a single two-dimensional Fourier transform.
So far nothing has been done to specify an
upcoming
wave instead of a downgoing wave.
The direction of the wave is defined by
the relationship of z and t that is required
to keep the phase constant in the expression exp![]() .If
.If ![]() were always positive, then +kz would
always refer to a downgoing wave and -kz to an upcoming wave.
Negative frequencies
were always positive, then +kz would
always refer to a downgoing wave and -kz to an upcoming wave.
Negative frequencies ![]() as well as positive frequencies are needed
to describe waves that have real (not complex) values.
So the proper description for a downgoing wave is that the signs
of
as well as positive frequencies are needed
to describe waves that have real (not complex) values.
So the proper description for a downgoing wave is that the signs
of ![]() and kz must be the same.
The proper description for an upcoming wave is the reverse.
With this clarification the integration variable in (24)
will be changed from
and kz must be the same.
The proper description for an upcoming wave is the reverse.
With this clarification the integration variable in (24)
will be changed from ![]() to kz.
to kz.
 |
(25) | |
| (26) | ||
| (27) |
| |
(28) |
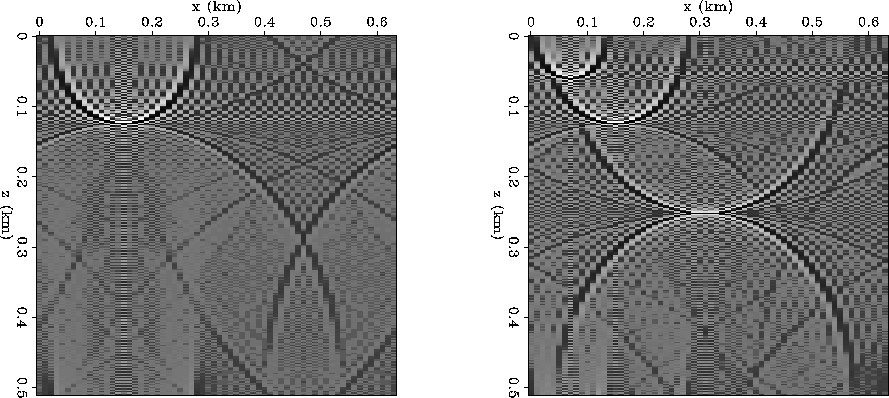
Samples of Stolt migration of impulses are shown in Figure 9.
 |
You can see the expected semicircular smiles.
You can also see a semicircular frown
hanging from the bottom of each semicircle.
The worst frown is on the deepest spike.
The semicircular mirrors have centers
not only at the earth's surface z=0 but
also at the bottom of the model ![]() .It is known that these frowns
can be suppressed by interpolating more carefully.
(Interpolation is the way you convert from a uniform mesh in
.It is known that these frowns
can be suppressed by interpolating more carefully.
(Interpolation is the way you convert from a uniform mesh in ![]() ,to a uniform mesh in kz).
Interpolate with say a
sinc
function instead of a linear interpolator.
A simpler alternative is to stay away from the bottom of the model,
i.e. pad with lots of zeroes.
,to a uniform mesh in kz).
Interpolate with say a
sinc
function instead of a linear interpolator.
A simpler alternative is to stay away from the bottom of the model,
i.e. pad with lots of zeroes.
|
stolt4
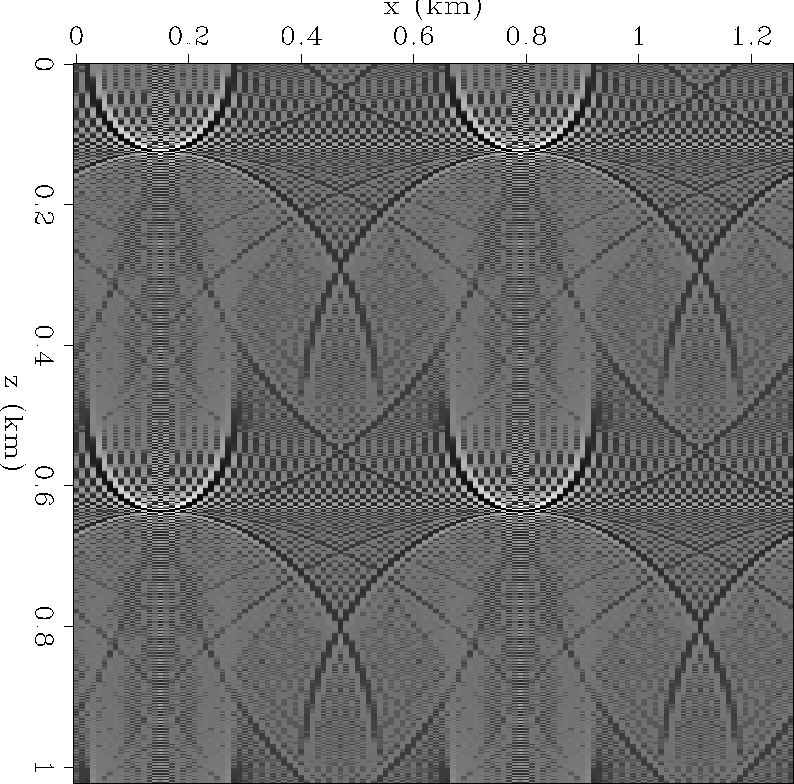
Figure 10 Periodicity of the output of the Stolt migration program. |  |
It seems that an extraordinary amount of zero padding is required on the time axis. To keep memory requirements reasonable, the algorithm can be reorganized as described in an exercise. Naturally, the periodicity in x also requires padding the x-axis with zeroes.
Below is a subroutine for Stolt migration.
Its input is assumed to be data after 2-D Fourier transformation
to ![]() -space,
and its output is the image in
to (kz, kx)-space,
so it needs a final transformation to (z,x)-space.
-space,
and its output is the image in
to (kz, kx)-space,
so it needs a final transformation to (z,x)-space.
subroutine stoltmig( nt,nz,nx, dt,dz,dx, vel, cftdata, cftimage)
integer it,iz,ix, nt,nz,nx, iw,ikz,ikx, nw,nkz,nkx
real    dt,dz,dx, w0,kz0,kx0, dw,dkz,dkx, pi, vel,vhalf, w,kz,kx, signum
complex ckzkx, cftdata(nt,nx), cftimage(nz,nx)
pi = 3.1415926
nw  = nt;       w0  = -pi/dt;   dw  = 2.*pi/(nt*dt);
nkz = nz;       kz0 = -pi/dz;   dkz = 2.*pi/(nz*dz);
nkx = nx;       kx0 = -pi/dx;   dkx = 2.*pi/(nx*dx);
do ikz= 1, nkz {        cftimage( ikz,   1) = (0.,0.) } # zero the Nyquist.
do ikx= 1, nkx {        cftimage(   1, ikx) = (0.,0.) } # zero the Nyquist.
vhalf = 0.5 * vel
do ikx = 2, nkx {       kx = kx0 + dkx * (ikx-1)
do ikz = 2, nkz {       kz = kz0 + dkz * (ikz-1)
        w = - signum( kz) * vhalf * sqrt( kx*kx + kz*kz)
        call cinterp1( w, nw,w0,dw, cftdata(1,ikx), ckzkx)
        if( w != 0.)
                cftimage(ikz,ikx) = ckzkx * abs( kz / w)
        else
                cftimage(ikz,ikx) = 0.
        }}
return;         end
stoltmig() uses the linear interpolation routine
cinterp1() ![[*]](http://sepwww.stanford.edu/latex2html/cross_ref_motif.gif) and the signum function
and the signum function ![]() done by routine
signum()
done by routine
signum() ![[*]](http://sepwww.stanford.edu/latex2html/cross_ref_motif.gif) .
In stoltmig() I have omitted
the theoretically required
.
In stoltmig() I have omitted
the theoretically required ![]() multiplication.
This angle-dependent scaling can be left as an exercise.
The effect of such an angle-dependent multiplier
is to scale the signal amplitude along the hyperbola
according to the local slope of the hyperbola.
multiplication.
This angle-dependent scaling can be left as an exercise.
The effect of such an angle-dependent multiplier
is to scale the signal amplitude along the hyperbola
according to the local slope of the hyperbola.
# Nearest neighbor interpolation would do this:    cbx = cb( 1.5 + (x-x0)/dx)
# Linear interpolation with the same definitions of variables is:
#
subroutine cinterp1( x, nx,x0,dx, cb, cbx)
integer ix,ixc,         nx
real    x, xc, x0, dx, fraction
complex cb(nx), cbx
xc      = (x-x0) / dx
ixc     =  xc
fraction = xc - ixc
ix      = 1 + ixc
if( ix < 1 )
                cbx = cb( 1)
else if( ix+1 > nx)
                cbx = cb( nx)
else
                cbx = (1.-fraction) * cb(ix)  +  fraction * cb(ix+1)
return; end
real function signum(x)
real x
        if      (x>0)  { signum =  1 }
        else if (x<0)  { signum = -1 }
        else           { signum =  0 }
return;end