


In ordinary wave propagation, energy propagates perpendicular to the wavefront. When there is anisotropy dispersion, the angle won't be perpendicular.
The apparent horizontal velocity seen along the earth's surface is dx/dt. The apparent velocity along a vertical, e.g., as seen in a borehole, is dz/dt. By geometry, both of these apparent speeds exceed the wave speed. The vector perpendicular to the wavefront with a magnitude inverse to the velocity is called the slowness vector:
| (14) |
The phase velocity vector is defined to go in the direction of the slowness vector, but have the speed of the wavefront normal. More precisely, the phase velocity vector is the slowness vector divided by its squared magnitude:
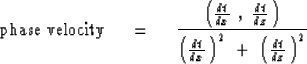 |
(15) |
For a disturbance of sinusoidal form,
namely, ![]()
![]() ,the phase
,the phase ![]() may be set equal to a constant:
may be set equal to a constant:
| (16) |
| |
(17) |
The direction of energy propagation is somewhat more difficult to derive, but it comes from the so-called group velocity vector:
| |
(18) |
An interesting aspect of anisotropy dispersion is that energy appears to
be going in one direction when it is really going in another.
An exaggerated instance of this occurs
when the group velocity has a downward component
and the phase velocity has an upward component.
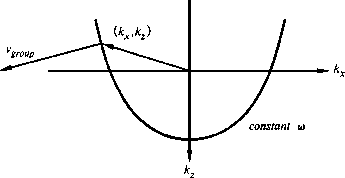
Figure 10,
depicting the dispersion relation of the 45![]() extrapolation equation, shows an example.
A slowness vector, which is in the direction of the
wavefront normal, has been selected
by drawing an arrow from the origin to the dispersion curve.
The corresponding direction of group velocity may now be determined
graphically by noting that group velocity is defined by
the gradient operator in equation (18).
Think of
extrapolation equation, shows an example.
A slowness vector, which is in the direction of the
wavefront normal, has been selected
by drawing an arrow from the origin to the dispersion curve.
The corresponding direction of group velocity may now be determined
graphically by noting that group velocity is defined by
the gradient operator in equation (18).
Think of ![]() as the height of a hill from which kz points
south and kx points east.
Then the dispersion relation is a contour of constant altitude.
Different numerical values of frequency
result from drawing Figure 10 to different scales.
The group velocity, in the direction of the gradient,
is perpendicular to the contours of constant
as the height of a hill from which kz points
south and kx points east.
Then the dispersion relation is a contour of constant altitude.
Different numerical values of frequency
result from drawing Figure 10 to different scales.
The group velocity, in the direction of the gradient,
is perpendicular to the contours of constant ![]() .
.
 |

The anisotropy-dispersion phenomenon
can be most clearly recognized in a movie,
although it can be understood on a single frame,
as in Figure 11.
The line drawing interprets energy flow from the top,
through the prism, reflecting at the 45![]() angle,
reflecting from the side of the frame,
and finally entering an area of the figure that is sufficiently
large and uncluttered for the phase fronts to be recognizable
as energy apparently propagating upward but really propagating downward.
angle,
reflecting from the side of the frame,
and finally entering an area of the figure that is sufficiently
large and uncluttered for the phase fronts to be recognizable
as energy apparently propagating upward but really propagating downward.
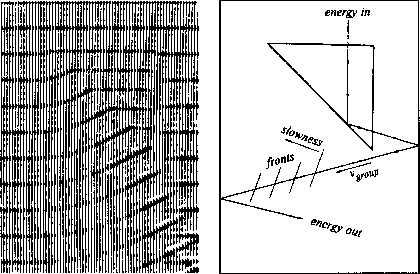 |
That neither energy nor information can propagate upward
in Figure 11
should be obvious when you consider
the program that calculates the wavefield.
The program does not have the entire frame in memory; it produces one
horizontal strip at a time from the strip just above.
Thus the movie's phase fronts, which appear to be moving upward, seem curious.
Theoretically, wave extrapolation
using the 45![]() equation is not expected to handle angles to 90
equation is not expected to handle angles to 90![]() .Yet the example in Figure 11
shows that these extreme cases are indeed handled,
although in a somewhat perverted way.
.Yet the example in Figure 11
shows that these extreme cases are indeed handled,
although in a somewhat perverted way.
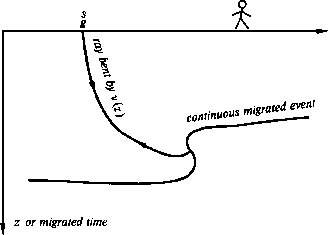 |
I once saw a similar circumstance on reflection seismic data from a geologically overthrusted area. The data could not be made available to me at the time, and by now is probably long lost in the owner's files, so I can only offer the line drawing in Figure 12, which is from memory. The increasing velocity with depth causes the ray to bend upward and reflect from the underside of the overthrust. To see what is happening in the wave equation, it is helpful to draw the dispersion curve at two different velocities, as in Figure 13.
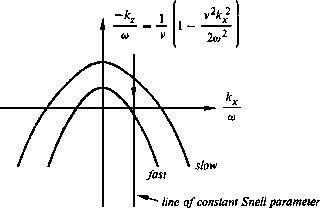 |
Downward continuation of a bit of energy
with some particular stepout ![]() begins
at an ordinary angle on the near-surface, slow-velocity dispersion curve.
But as deeper velocity material is encountered, that same stepout
implies a negative phase velocity.
Although the thrust angle is unlikely to be quantitatively correct,
the general picture is appropriate.
It is like Figure 11.
begins
at an ordinary angle on the near-surface, slow-velocity dispersion curve.
But as deeper velocity material is encountered, that same stepout
implies a negative phase velocity.
Although the thrust angle is unlikely to be quantitatively correct,
the general picture is appropriate.
It is like Figure 11.