|
intro
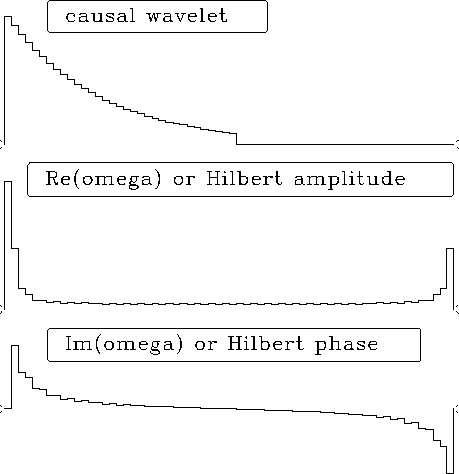
Figure 1 Both positive and negative times and frequencies of a real causal response (top) and real (mid) and imaginary (bottom) parts of its FT. |  |
![[*]](http://sepwww.stanford.edu/latex2html/cross_ref_motif.gif) explains that many plots in this book
have various interpretations.
Superficially,
the plot pairs represent cosine transforms of real even functions.
But since the functions are even, their negative halves are not shown.
An alternate interpretation of the plot pairs
is that one signal is real and causal.
This is illustrated in full detail in Figure 1.
explains that many plots in this book
have various interpretations.
Superficially,
the plot pairs represent cosine transforms of real even functions.
But since the functions are even, their negative halves are not shown.
An alternate interpretation of the plot pairs
is that one signal is real and causal.
This is illustrated in full detail in Figure 1.|
intro
Figure 1 Both positive and negative times and frequencies of a real causal response (top) and real (mid) and imaginary (bottom) parts of its FT. |  |
Half of the values in Figure 1 convey no information:
these are the zero values at negative time,
and the negative frequencies of the FT.
In other words, the right half of Figure 1 is redundant,
and is generally not shown.
Likewise, the bottom plot, which is the imaginary part,
is generally not shown,
because it is derivable in a simple way from given information.
Computation of the unseen imaginary part is called
``Hilbert transform.''
Here we will investigate details and applications of the Hilbert transform.
These are surprisingly many, including
![]() phase-shift filtering, envelope functions,
the instantaneous frequency function,
and
relating amplitude spectra to phase spectra.
phase-shift filtering, envelope functions,
the instantaneous frequency function,
and
relating amplitude spectra to phase spectra.
Ordinarily a function is specified entirely in the time domain or entirely in the frequency domain. The Fourier transform then specifies the function in the other domain. The Hilbert transform arises when half the information is in the time domain and the other half is in the frequency domain. (Algebraically speaking, any fractional part could be given in either domain.)