 |
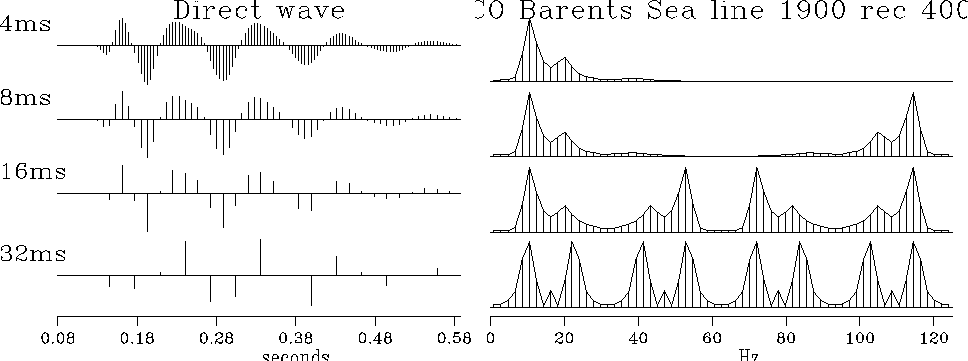
Figure 2 Raw data is shown on the top left, of about a half-second duration. Right shows amplitude spectra (magnitude of FT). In successive rows the data is sampled less densely.
 |
The original data is sampled at an interval of 4 milliseconds,
which is 250 times per second.
Thus, the Nyquist frequency ![]() is 125 Hz.
Negative frequencies are not shown,
since the amplitude spectrum
at negative frequency is identical
with that at positive frequency.
Think of extending the top row of spectra
in Figure 3
to range from minus 125 Hz to plus 125 Hz.
Imagine the even function of frequency
centered at zero frequency--we will soon see it.
In the second row of the plot,
I decimated the data to 8 ms.
This drops the Nyquist frequency to 62.5 Hz.
Energy that was at -10 Hz appears at
125-10 Hz in the second row spectrum.
The appearance of what were formerly small negative frequencies
near the Nyquist frequency is called ``folding'' of the spectrum.
In the next row
the data is sampled at 16 ms intervals, and in the last row
at 32 ms intervals.
The 8 ms sampling seems OK,
whereas the 32 ms sampling looks poor.
Study how the spectrum changes
from one row to the next.
is 125 Hz.
Negative frequencies are not shown,
since the amplitude spectrum
at negative frequency is identical
with that at positive frequency.
Think of extending the top row of spectra
in Figure 3
to range from minus 125 Hz to plus 125 Hz.
Imagine the even function of frequency
centered at zero frequency--we will soon see it.
In the second row of the plot,
I decimated the data to 8 ms.
This drops the Nyquist frequency to 62.5 Hz.
Energy that was at -10 Hz appears at
125-10 Hz in the second row spectrum.
The appearance of what were formerly small negative frequencies
near the Nyquist frequency is called ``folding'' of the spectrum.
In the next row
the data is sampled at 16 ms intervals, and in the last row
at 32 ms intervals.
The 8 ms sampling seems OK,
whereas the 32 ms sampling looks poor.
Study how the spectrum changes
from one row to the next.
The spectrum suffers no visible harm in the drop from 4 ms to 8 ms. The 8 ms data could be used to construct the original 4 ms data by transforming the 8 ms data to the frequency domain, replacing values at frequencies above 125/2 Hz by zero, and then inverse transforming to the time domain.
(Airguns usually have a higher frequency content than we see here. Some high-frequency energy was removed by the recording geometry, and I also removed some when preparing the data.)