


| |
(11) |
| |
(12) |
| |
(13) |
| |
(14) |
In the last section we saw that to multiply two polynomials the coefficients must be convolved. The same process in Fourier transform language is that a product in the frequency domain corresponds to a convolution in the time domain.
Although one thinks of a Fourier transform as an integral
which may be difficult or impossible to do,
the Z transform is always easy,
in fact trivial.
To do a Z transform one merely attaches
powers of Z to successive data points.
When one has B(Z) one can refer to it either as a time
function or a frequency function,
depending on whether one graphs the polynomial coefficients
or if one evaluates and graphs ![]() for
various frequencies
for
various frequencies ![]() .Notice that as
.Notice that as ![]() goes from zero to
goes from zero to ![]() ,
,![]() migrates once around the unit circle in the counterclockwise direction.
migrates once around the unit circle in the counterclockwise direction.
If taking a Z transform amounts to attaching powers of Z to successive points of a time function, then the inverse Z transform must be merely identifying coefficients of various powers of Z with different points in time. How can this simple ``identification of coefficients'' be the same as the apparently more complicated operation of inverse Fourier integrals? The inverse Fourier integral is
| |
(15) |
First notice that the integration of Zn about the unit circle or
![]() over
over ![]() gives zero unless n = 0
because cosine and sine are oscillatory; that is,
gives zero unless n = 0
because cosine and sine are oscillatory; that is,
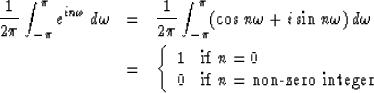 |
||
| (16) |
| |
(17) |
| |
(18) |
In this book and many others,
it is common to assume that the time span between data samples
![]() is unity.
To adapt given equations to other values of
is unity.
To adapt given equations to other values of ![]() ,one only need replace
,one only need replace ![]() by
by ![]() ;that is,
;that is,
| |
(19) |
With Z transforms we have the spectrum given
on a range of ![]() for
for ![]() .In the limit
.In the limit ![]() goes to zero,
goes to zero,
![]() has the same infinite limits as the Fourier integral.
has the same infinite limits as the Fourier integral.
When a continuous function is approximated by a sampled function,
it is necessary to take the sample spacing
![]() small enough.
The basic result of elementary texts is that,
if there is no appreciable energy
in a Fourier transform for frequencies higher than some frequency
small enough.
The basic result of elementary texts is that,
if there is no appreciable energy
in a Fourier transform for frequencies higher than some frequency
![]() ,then there is no appreciable loss of information
if the sampled at least two points per wavelength.
Figure 6 shows how insufficient sampling of a sine wave
often causes it to appear as a sine wave of lower frequency.
,then there is no appreciable loss of information
if the sampled at least two points per wavelength.
Figure 6 shows how insufficient sampling of a sine wave
often causes it to appear as a sine wave of lower frequency.
|
1-7a
Figure 6 Subsampled sinusoid. | 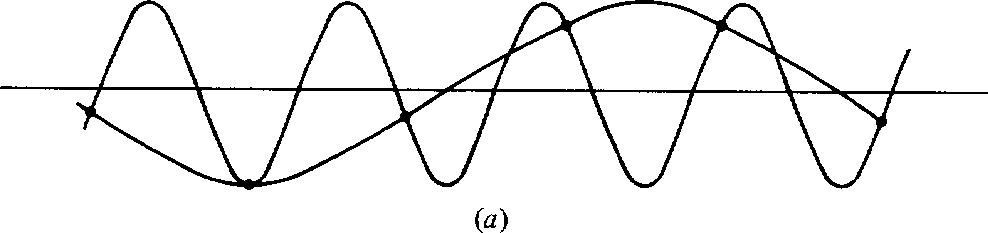 |

If a high-frequency sinusoid is sampled insufficiently often,
it becomes indistinguishable from a lower-frequency sinusoid.
For this reason ![]() is said to be the folding frequency,
as higher frequencies are folded down to look like lower frequencies.
is said to be the folding frequency,
as higher frequencies are folded down to look like lower frequencies.
In practice, quasi-sinusoidal waves are always sampled more frequently than twice per wavelength.
Next we wish to examine odd/even symmetries to see how they are affected in Fourier transformation. The even part et of a time function bt is defined as
| |
(20) |
| |
(21) |
| |
(22) |
Consider a simple, real, even time function such as
(b-1, b0, b1) = (1, 0, 1).
Its transform ![]() is an even function of
is an even function of
![]() since
since ![]() .Consider the real, odd time function (b-1, b0, b1) = (-1, 0, 1).
Its transform
.Consider the real, odd time function (b-1, b0, b1) = (-1, 0, 1).
Its transform ![]() is imaginary and odd,
since
is imaginary and odd,
since ![]() .Likewise, the transform of the imaginary even function (i, 0, i) is
the imaginary even function
.Likewise, the transform of the imaginary even function (i, 0, i) is
the imaginary even function ![]() and the transform of the
imaginary odd function (-i, 0, i) is real and odd.
Let r and i refer to real and imaginary,
e and o refer to even and odd,
and lower-case and upper-case refer to time and frequency functions.
A summary of the symmetries
of Fourier transformation is shown in Figure 7.
and the transform of the
imaginary odd function (-i, 0, i) is real and odd.
Let r and i refer to real and imaginary,
e and o refer to even and odd,
and lower-case and upper-case refer to time and frequency functions.
A summary of the symmetries
of Fourier transformation is shown in Figure 7.
|
1-7b
Figure 7 Mnemonic table illustrating how even/odd and real/imaginary properties are affected by Fourier transformation. |  |
More elaborate time functions can be made up by adding together the two
point functions we have considered.
Since sums of even functions are even,
and so on,
the table of Figure 7 applies to all time functions.
Note that an arbitrary time function takes the form
![]() .On transformation of bt,
each of the four individual parts transforms according to the table
.On transformation of bt,
each of the four individual parts transforms according to the table