The 2-D impedance inversion has shown that the hydrate appears to significantly change its lateral characteristic. This structure might be either related to the hydrate itself and its changing properties and occurrence in the pore space, or some real structure beneath the BSR. In order to evaluate the obtained impedance contrasts more in terms of velocity contrast, I explored which velocity/impedance model could reproduce the AVO data locally at three different BSR structures. To minimize the variation and noise of the data, I assumed that in the area I chose the local lithology properties do not vary within at least 150 m. Thus I used at least three adjacent CMP gathers to average my amplitude response. Several velocity models were constructed that were constrained to preserve the average interval velocity of the area. The density contrast across the BSR is assumed to be known and held constant in the modeling. Since the density of pure hydrate is significantly larger than that of gas, I assumed a slight decrease in the density at the BSR. This is supported by the well data in the area Ecker (1997). Synthetic AVO responses were then estimated for the individual models using Zoeppritz equations and compared with the seismic data. I have shown in the other paper included in this report Ecker (1997) that local AVO analysis is rather robust for the estimation of the acoustic properties, but can include a significant error for the S-wave properties depending on the variance of the data. Thus, several models might fit the data within a reasonable error bound and I will give a possible range as an error estimate.
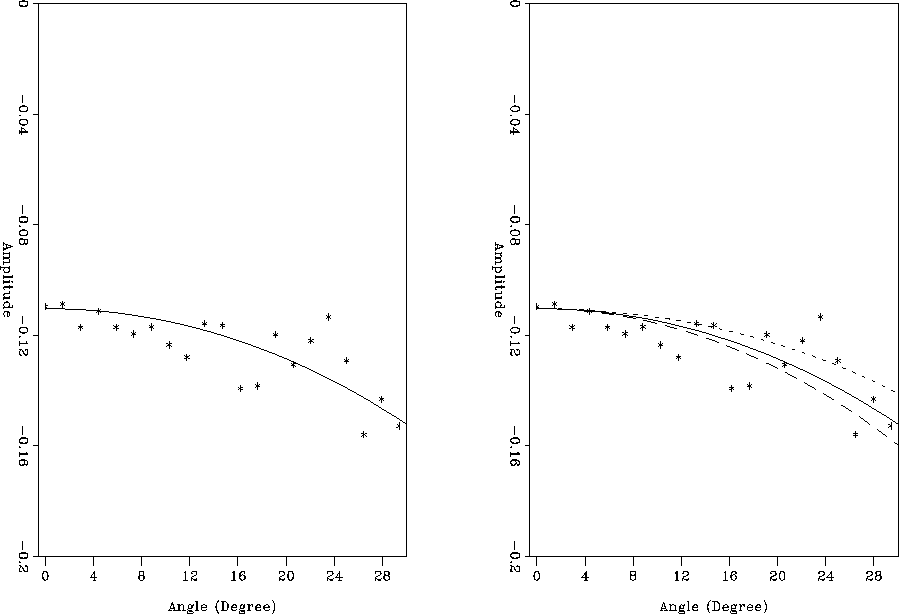
In the first model, I picked the amplitude at a place of opposite P- and
S-impedance contrasts at 50 km distance. The picked amplitudes as
seen in the left panel of Figure 9, are increasingly negative
with increasing angle. The modeling shows that his is consistent with a
decrease in P-wave velocity of approximately 400 m/s across the BSR and
a simultaneous increase in S-wave velocity of about 150 m/s. The best fit
obtained from Zoeppritz modeling is overlain with the data.
In order to give an idea about the goodness of fit, I plot in the right
panel of Figure 9 how the curves would look like for changes
in the S-wave velocity contrast of ![]() 100 m/s.
A similar results was obtained in a previous
study of part of the data Ecker and Lumley (1994a) and explained by the
sediment containing hydrate to be uncemented and thus mechanically weak
Ecker et al. (1996).
100 m/s.
A similar results was obtained in a previous
study of part of the data Ecker and Lumley (1994a) and explained by the
sediment containing hydrate to be uncemented and thus mechanically weak
Ecker et al. (1996).
 |
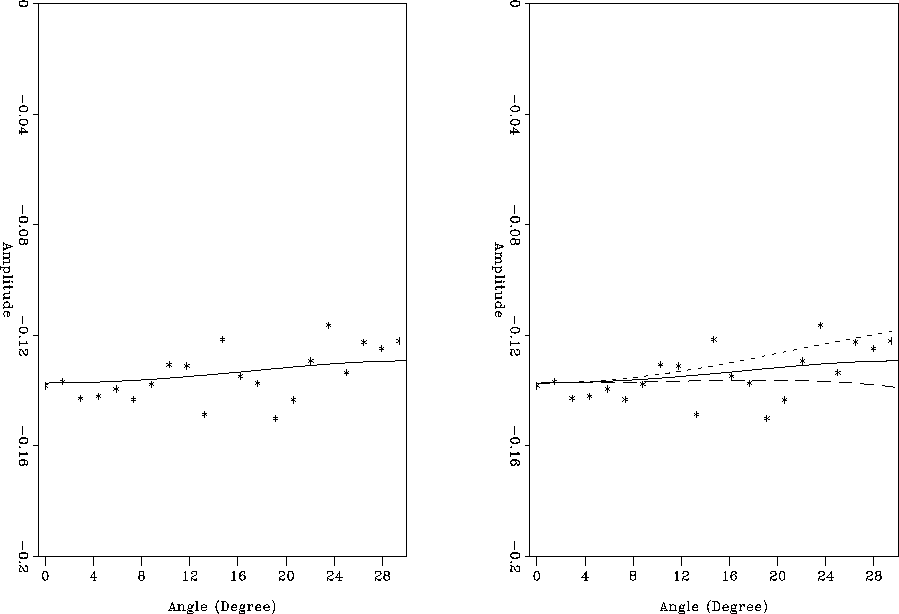
The next AVO picks were obtained at a distance of about 47 km, in an area of
event interference.
The amplitudes show a trend which is
clearly opposed to the previous one. Instead of increasing with
increasing offset, the amplitudes decrease. Modeling this behavior results
again in a significantly large negative P-impedance contrast, but
an S-contrast of the same sign (Figure 10).
The best data fit suggest a decrease in
S-wave velocity of about 300 m/s. Considering the data variations this would
be determined within a ![]() 50 m/s bound as seen in the right side of
Figure 10. This model indicates a completely different
hydrate behavior than before. However, it must be carefully evaluated since
the amplitude trend might have been distorted from interference, and thus
might not represent the actual BSR trend. A possible explanation for this
kind of behavior might be that the hydrate is not underlain by gas but
by brine saturated sediment in this area. Due to the increase in density,
this would lead to a positive S-wave velocity contrast.
50 m/s bound as seen in the right side of
Figure 10. This model indicates a completely different
hydrate behavior than before. However, it must be carefully evaluated since
the amplitude trend might have been distorted from interference, and thus
might not represent the actual BSR trend. A possible explanation for this
kind of behavior might be that the hydrate is not underlain by gas but
by brine saturated sediment in this area. Due to the increase in density,
this would lead to a positive S-wave velocity contrast.
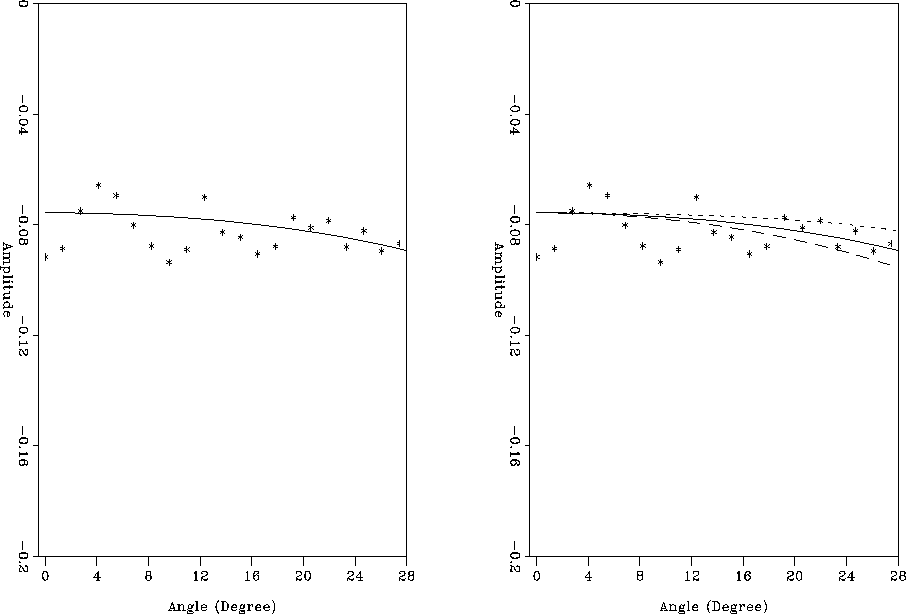
In the third modeling evaluation, I picked the amplitudes at a section
near the flank of the BSR (35 km). The amplitudes display a trend which
is between the two previous responses. The AVO modeling results in
a velocity model that again has a negative, but smaller P-wave velocity
contrast across the BSR. The best data fit is reached with a zero shear
wave contrast, meaning that there is no change in the shear wave
velocity and density across the BSR. The error bounds suggest a
![]() 50 m/s limit
on the amplitudes, which can mean that there is either a small positive or a
small negative contrast. This might support the hypothesis of only
a small amount of hydrate saturation of the sediments in this area.
50 m/s limit
on the amplitudes, which can mean that there is either a small positive or a
small negative contrast. This might support the hypothesis of only
a small amount of hydrate saturation of the sediments in this area.
 |
 |
The different velocity at the three BSR sections (strong, interfering, flank) are displayed in Figure 12. It is obvious that while the P-wave velocity change stays approximately the same, at least in sign, there is considerable change in the shear wave behavior.
 |