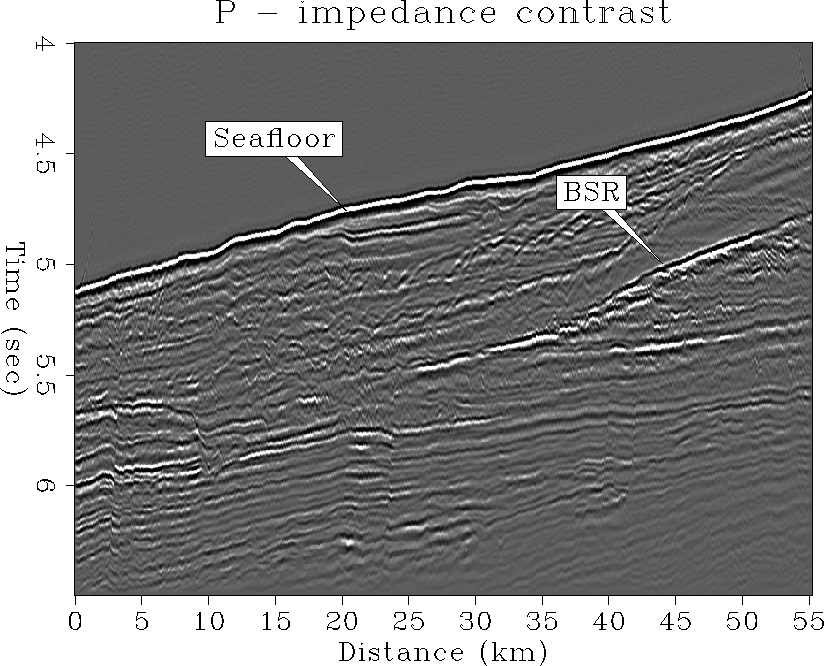
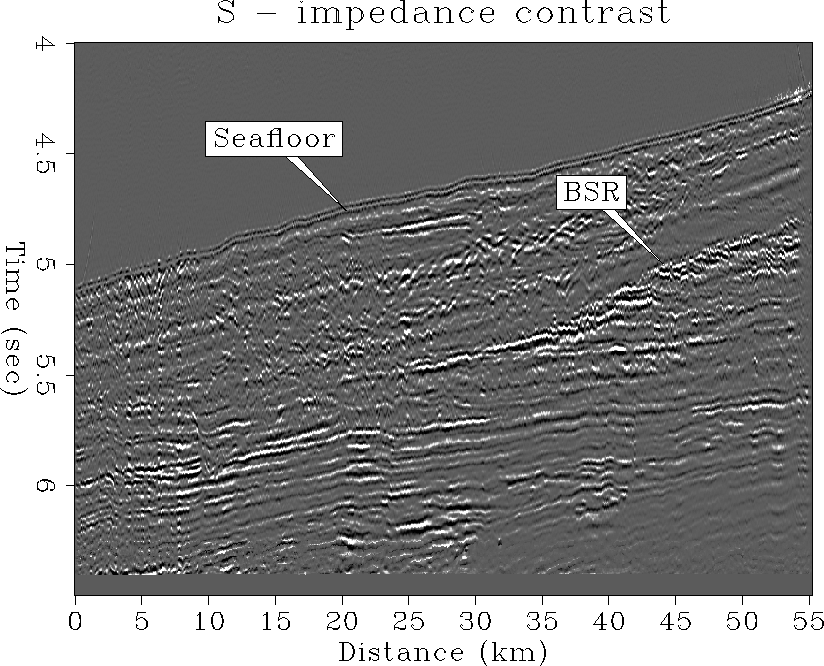
To evaluate the behavior of P- and S-impedance contrast across the different BSR sections and the gas zone, I performed a least-squares elastic parameter inversion Lumley (1993). This technique fits the prestack migrated AVO gathers at each pseudo-depth and surface position to the theoretical P- and S-impedance curves based on linearized Zoeppritz equations Aki and Richards (1980):
![]()
where ![]() is the reflectivity,
is the reflectivity, ![]() is the angle of incidence,
Ip and Is are the P-impedance and S-impedance contrasts, respectively.
The density contrast is given by D and
is the angle of incidence,
Ip and Is are the P-impedance and S-impedance contrasts, respectively.
The density contrast is given by D and ![]() is the background
is the background
![]() ratio. Since the term depending on the density contrast will
only contribute for angles above 40 degrees, it is not used here. The maximum
angle of the data is not larger than 33 degrees. Based on the drilling
information in the area, I choose a
ratio. Since the term depending on the density contrast will
only contribute for angles above 40 degrees, it is not used here. The maximum
angle of the data is not larger than 33 degrees. Based on the drilling
information in the area, I choose a ![]() of about 0.1 since the sediments
display overall low S-wave velocity character Ecker (1997).
The inversion results are
shown in Figures 6 and 7.
of about 0.1 since the sediments
display overall low S-wave velocity character Ecker (1997).
The inversion results are
shown in Figures 6 and 7.
The P-impedance section clearly shows both a strong seafloor and a strong BSR contrast of opposite polarity but comparable magnitude. The negative contrast at the BSR is caused by the decrease of the velocity at the transition from hydrated sediment to gas-saturated sediment. The contrast at the BSR is strongest between 45 and 50 km, as was expected from the velocity analysis and the amplitude behavior. Significantly less contrast is displayed in the area of BSR discontinuity (between 35 and 40 km).
The S-impedance contrast shows that the BSR has a significantly higher contrasts than the seafloor. As opposed to the very continuous P-impedance contrast along parts of the BSR, the S-impedance contrast displays a very fractured character. Strong contrasts are obtained from the rapid structure underneath the BSR which is interfering with the BSR contrast itself. In areas of small interference, the BSR contrast is of the same polarity as the seafloor, implying a positive impedance contrast. One reason for the P-impedance map not to show this fracturing effect might either be that those structures do not have an effect in P-impedance, or it is so small compared to the one of the BSR that it is not visible in the impedance map. The effects on P-wave velocity and density could cancel each other out. Since it is mainly visible in the S-impedance contrast section, this means that there is a pronounced contrast in shear moduli or density.
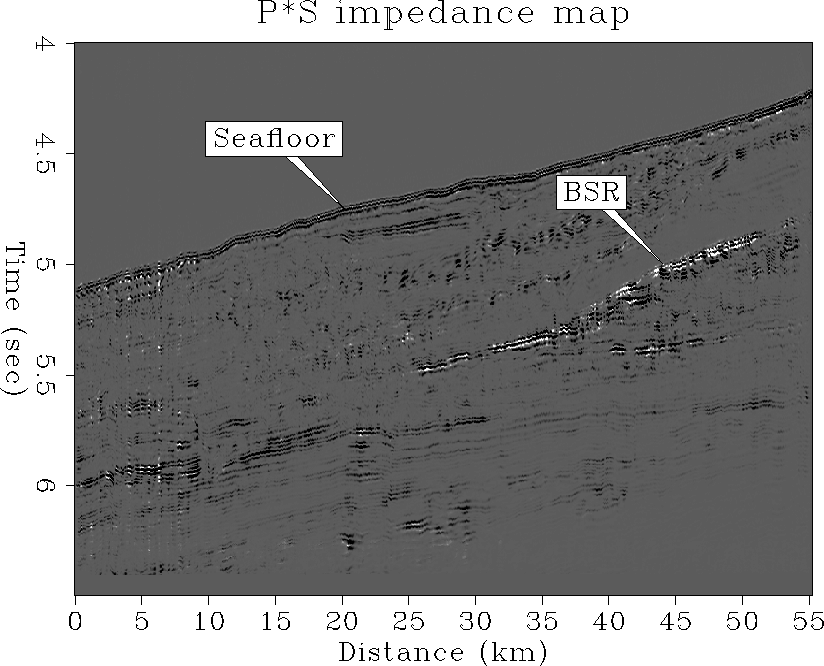
The differences between P-impedance and S-impedance behavior are more pronounced on a simple P*S impedance map as shown in Figure 8. Impedances of the same sign are plotted as blue, while impedance contrasts of opposite behavior are plotted as red. Between 40 and 50 km, the BSR is characterized by laterally varying contrasts. If there is no strong interference with the underlaying structure, P- and S-impedance appear to have the opposite sign, thus indicating a negative P-impedance contrast but a positive S-impedance contrast. The structure underneath the BSR shows P- and S-impedance contrasts of the same sign, however. The flank of the BSR between 35 and 25 km seems to show that most of the P- and S-impedance contrasts behave equally (either increasing or decreasing).
 |
 |
 |