

Next: RESULTS
Up: Abma: Detecting gravitational waves
Previous: RESPONSE OF THE EARTH
The data were first converted from the original format
into a format suitable for processing
with the available seismic software.
Next, it was sorted into time and station order
by groups of one year.
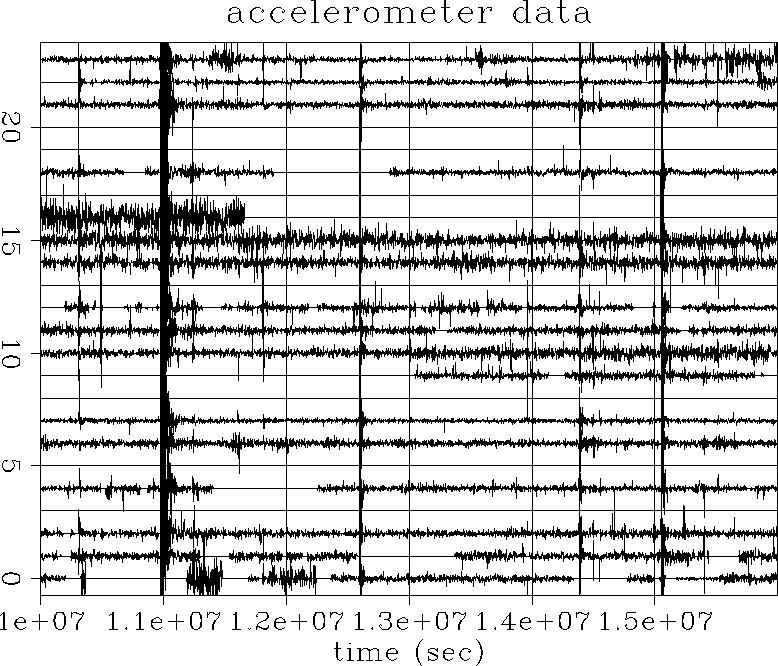
A sample of the sorted data shown in Figure ![[*]](http://sepwww.stanford.edu/latex2html/cross_ref_motif.gif) shows earthquakes, noisy traces, and dead zones.
The
noisy traces are probably caused by water-wave action at stations
located on small islands. For example, trace 16 in Figure
shows earthquakes, noisy traces, and dead zones.
The
noisy traces are probably caused by water-wave action at stations
located on small islands. For example, trace 16 in Figure ![[*]](http://sepwww.stanford.edu/latex2html/cross_ref_motif.gif) is from the station located at Rarotonga, on the Cook Islands.
The missing data is caused by
stations not in operation, data lost at tape changes, or data removed in
the original cleaning process.
is from the station located at Rarotonga, on the Cook Islands.
The missing data is caused by
stations not in operation, data lost at tape changes, or data removed in
the original cleaning process.
sort
Figure 7 A one month
sample of the IDA data.


To separate the response of the earth to gravitational waves
from the seismic background, high amplitude earthquake events need to be removed
from the data. I was fortunate to have data with instrument spikes
and much other non-seismic noise manually
removed. To remove the earthquake noise, a program scanned each
station's data for the maximum value, then if this maximum value
was above a given threshold, the samples recorded one hour before and
five hours after were zeroed. After zeroing, the station's samples
were once again searched for the maximum value, and if that maximum value was
again above the threshold, the zeroing and searching
process was repeated until the maximum amplitude
was below the threshold.
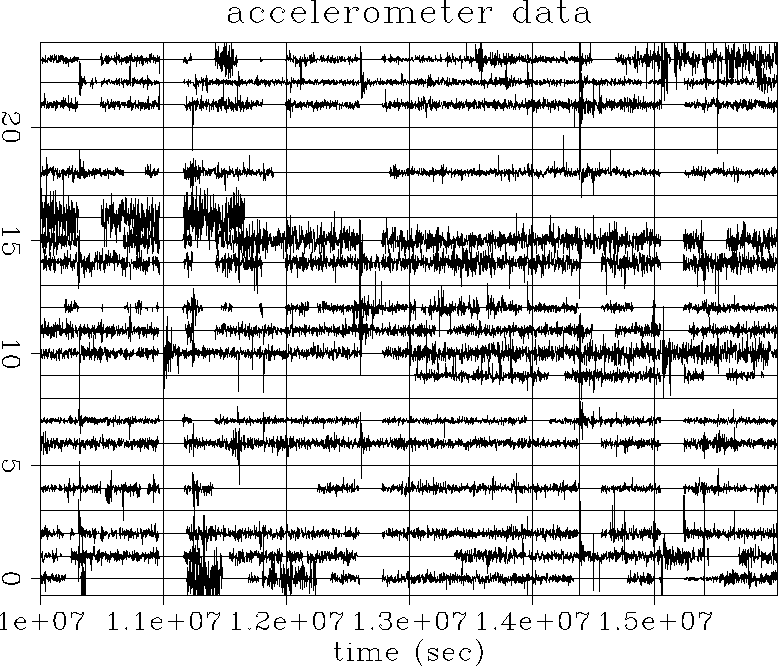
Figure ![[*]](http://sepwww.stanford.edu/latex2html/cross_ref_motif.gif) shows that the large earthquakes were
removed, but smaller events
are still present. Notice that the noisy traces also had some zeroed zones.
If the maximum value considered to be an earthquake event is lowered,
more data are removed, and much of the signal may be lost.
shows that the large earthquakes were
removed, but smaller events
are still present. Notice that the noisy traces also had some zeroed zones.
If the maximum value considered to be an earthquake event is lowered,
more data are removed, and much of the signal may be lost.
zero
Figure 8 The sample
in the previous figure
with
the earthquake noise removed.


This earthquake removal process could be improved by changing the
mute time according to the strength of the earthquake, or by removing
the earthquakes according to the tables of earthquake events that are
available. The process used has the advantage of simplicity.
Many small spikes still remain in the records. These spikes could have been
removed by a median filter.
To attempt to
produce a sharp response in frequency to any signals in the data
and to further suppress noise and enhance weak signal, the data were
gained. In the gained examples, a
160 minute, or 480 sample sliding gain window was used. Zeroed
data were ignored by this gain to avoid undesirable effects near the
ends of zeroed zones.
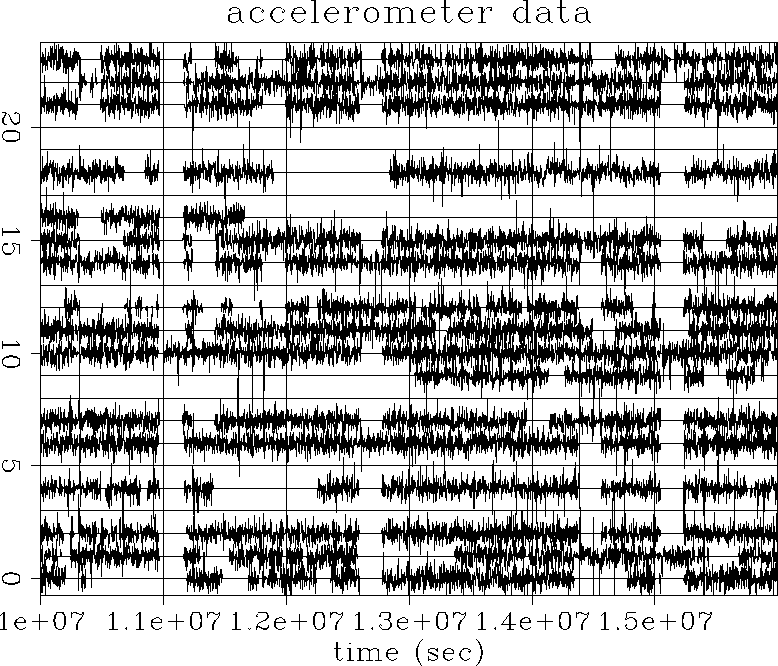
As seen in Figure ![[*]](http://sepwww.stanford.edu/latex2html/cross_ref_motif.gif) , the traces are better equalized, but spikes
remain.
, the traces are better equalized, but spikes
remain.
gain
Figure 9 One month of recording with
earthquake noise removed, then a gain applied.


The data for each station were tapered around the zones zeroed
by the previous processes with simple cosine tapers.
The length of the taper was 25 hours, or
4500 samples. This taper length was used to keep the effects of the
truncation away from the frequency range of interest.
Before tapering, small groups of non-zero samples were removed, and during
tapering, small groups of zeros were ignored to prevent excessive overlapping
of the tapers.
While this process eliminates much of the data,
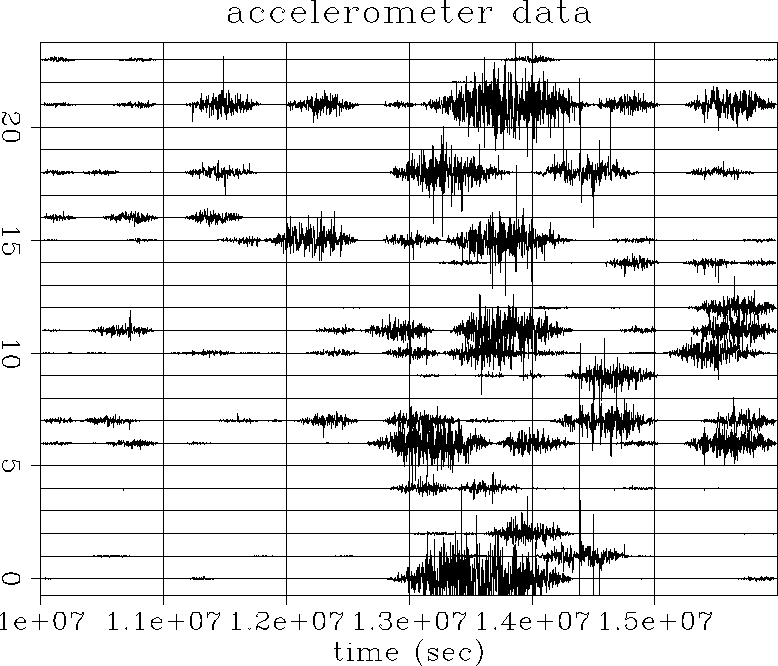
it also should avoid creating noise in the spectra. Figure
![[*]](http://sepwww.stanford.edu/latex2html/cross_ref_motif.gif) shows an example of this process.
shows an example of this process.
taper
Figure 10 One month of recording with
earthquake noise removed, gain applied, and tapered.


Two different attempts at detecting
gravitational wave excitations were done.
The first attempt was to correct the
data for the rotation of the earth with respect to fixed
directions in space, and then produce three spectra corresponding to
three perpendicular directions in space. The second attempt was to
correct for the rotation of the earth, then calculate the spectra
for both polarities in many directions.
The first method would have provided some
indication of direction, but the signal strength would have had to be high
to detect an event. This method had the advantage of being fast.
The second method, that of examining many directions, would allow a more
reliable measure of directional consistency. The results shown here
are from the second method.
The second method is slow since
it calculates spectra for 84 directions and two polarities for each direction.
The polarization could have been
used to determine the consistency in direction of
a signal in time. For binary systems,
a constant direction and polarization is expected.
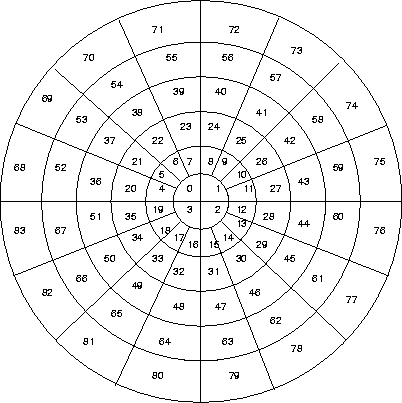
The directions scanned for possible gravitational waves are shown in the
grid displayed in
Figure ![[*]](http://sepwww.stanford.edu/latex2html/cross_ref_motif.gif) .
Only one hemisphere was examined, since the excitation caused
by a gravitational wave in one direction is the same as the excitation
caused by a wave moving in the opposite direction.
The numbers shown in Figure
.
Only one hemisphere was examined, since the excitation caused
by a gravitational wave in one direction is the same as the excitation
caused by a wave moving in the opposite direction.
The numbers shown in Figure ![[*]](http://sepwww.stanford.edu/latex2html/cross_ref_motif.gif) correspond to the trace numbers shown
in Figure
correspond to the trace numbers shown
in Figure ![[*]](http://sepwww.stanford.edu/latex2html/cross_ref_motif.gif) and the other directional spectra.
The center of the figure is north.
and the other directional spectra.
The center of the figure is north.

The instrument response was not removed from the data since
it is expected to be constant between stations at the frequencies of
interest. Removing the response also increases the energy at low
frequencies making the data unbalanced and difficult to display.
Ideally, the response of a gravitational wave would be a spike in
frequency on the spectra. This spike will be smoothed somewhat by
the earth's orbit about the sun, but it will be a small change
at the low frequencies considered
here. The frequency increment
corresponding to the Fourier transform of a data sequence of a
year is  Hz. For signals with one-hour periods, the
frequency change from the earth's orbital velocity
is
  Hz. For 10 hour
periods, the change is
  Hz. This smear of the response
is likely to be small compared to the effects of the earth's response and
to the muting, gaining, and tapering of the time series to remove noise.


Next: RESULTS
Up: Abma: Detecting gravitational waves
Previous: RESPONSE OF THE EARTH
Stanford Exploration Project
11/17/1997
![[*]](http://sepwww.stanford.edu/latex2html/cross_ref_motif.gif) shows earthquakes, noisy traces, and dead zones.
The
noisy traces are probably caused by water-wave action at stations
located on small islands. For example, trace 16 in Figure
shows earthquakes, noisy traces, and dead zones.
The
noisy traces are probably caused by water-wave action at stations
located on small islands. For example, trace 16 in Figure ![[*]](http://sepwww.stanford.edu/latex2html/cross_ref_motif.gif) is from the station located at Rarotonga, on the Cook Islands.
The missing data is caused by
stations not in operation, data lost at tape changes, or data removed in
the original cleaning process.
is from the station located at Rarotonga, on the Cook Islands.
The missing data is caused by
stations not in operation, data lost at tape changes, or data removed in
the original cleaning process.
