

Next: POSSIBLE IMPROVEMENTS
Up: Abma: Detecting gravitational waves
Previous: PROCESSING SEQUENCE
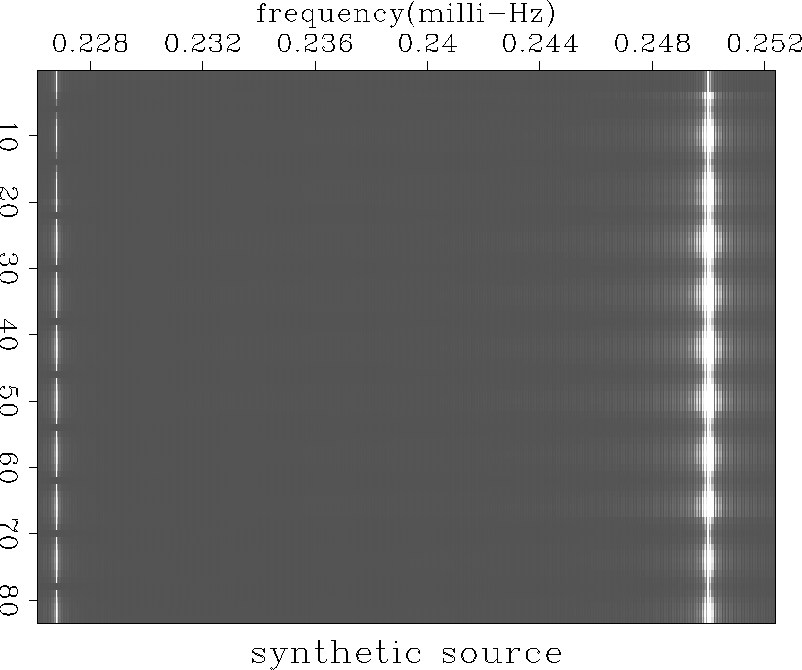
The synthetic response to a gravitational wave source in position 43
of Figure ![[*]](http://sepwww.stanford.edu/latex2html/cross_ref_motif.gif) is shown in Figure
is shown in Figure ![[*]](http://sepwww.stanford.edu/latex2html/cross_ref_motif.gif) .
This figure shows a set of spectra weighted to the directions shown in
Figure
.
This figure shows a set of spectra weighted to the directions shown in
Figure ![[*]](http://sepwww.stanford.edu/latex2html/cross_ref_motif.gif) by match filtering against the predicted
gravitational wave response.
Each trace number corresponds to
a direction shown on the grid in Figure
by match filtering against the predicted
gravitational wave response.
Each trace number corresponds to
a direction shown on the grid in Figure ![[*]](http://sepwww.stanford.edu/latex2html/cross_ref_motif.gif) . The spectra peak is
at 0.25 milli-Hz, and the maximum amplitude is at trace 43 as expected, but
the definition of the direction is poor.
. The spectra peak is
at 0.25 milli-Hz, and the maximum amplitude is at trace 43 as expected, but
the definition of the direction is poor.
specsrc
Figure 12 The
directionally weighted spectra of a synthetic gravitational wave source
at position 43 on the grid in Figure 10. The signal peak is at 0.25 milli-Hz.
Notice the weak ghost at the left caused by the corrections for the
earth's rotation.

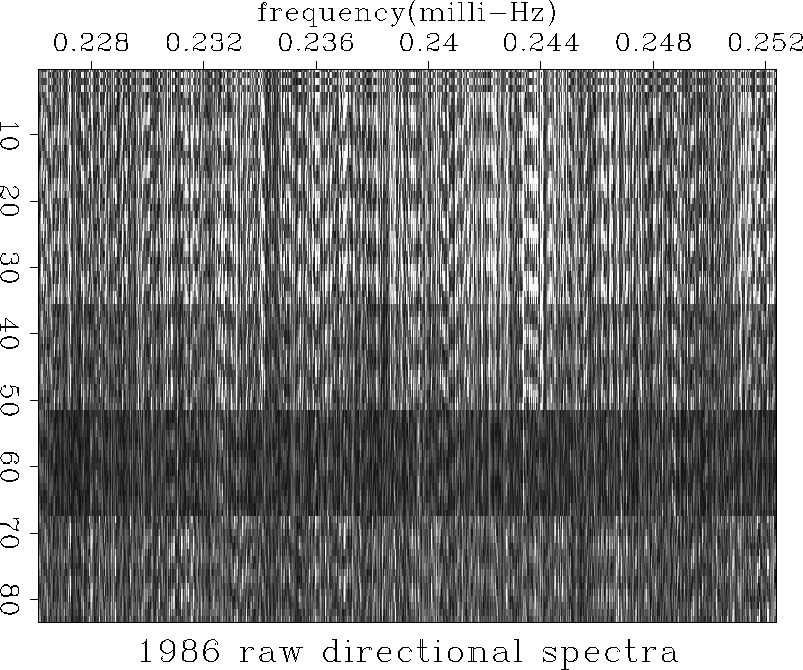
The directionally weighted spectra for the raw data without gaining,
earthquake removal or tapering is shown in Figure ![[*]](http://sepwww.stanford.edu/latex2html/cross_ref_motif.gif) . The
spectra are generally noisy, and no strong response similar to that in
Figure
. The
spectra are generally noisy, and no strong response similar to that in
Figure ![[*]](http://sepwww.stanford.edu/latex2html/cross_ref_motif.gif) is seen, but
there is a promising weak event near 0.244 milli-Hz.
is seen, but
there is a promising weak event near 0.244 milli-Hz.
rawspec
Figure 13 A sample of the
directionally weighted spectra for 1986 for the raw input.

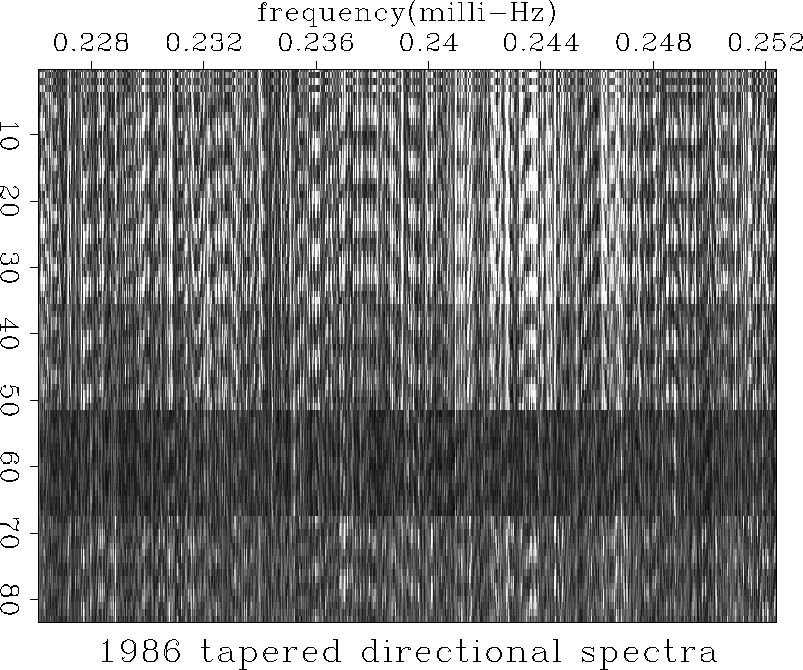
The original data then had a taper applied to the nonzeroed portions to
remove the effects of the sharp truncations. This result is shown in
Figure ![[*]](http://sepwww.stanford.edu/latex2html/cross_ref_motif.gif) . Notice that the spectra are still noisy, indicating
that the earthquake and other noise are still dominating.
The event at 0.244 milli-Hz is clearer, but still not convincing.
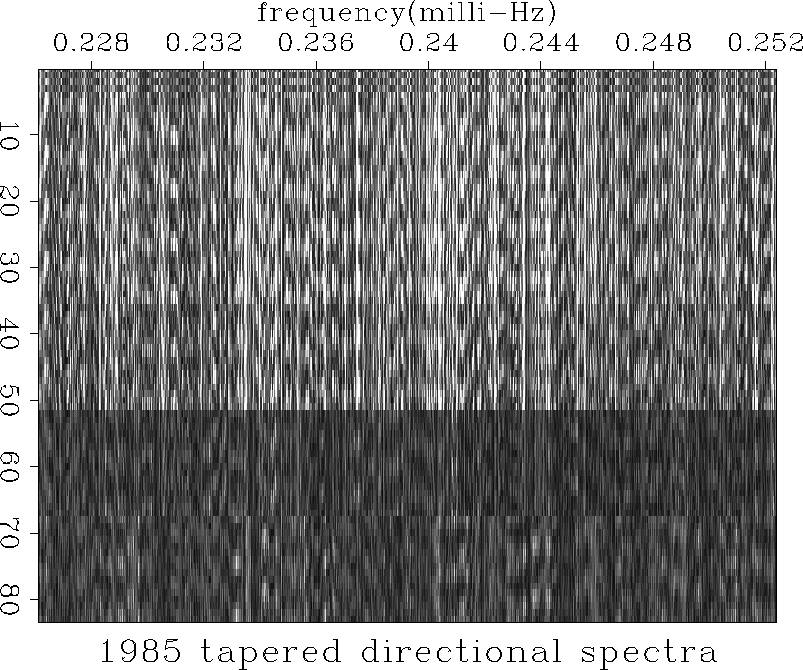
When the 1986 spectra in
Figure
. Notice that the spectra are still noisy, indicating
that the earthquake and other noise are still dominating.
The event at 0.244 milli-Hz is clearer, but still not convincing.
When the 1986 spectra in
Figure ![[*]](http://sepwww.stanford.edu/latex2html/cross_ref_motif.gif) is compared to the 1985 spectra in Figure
is compared to the 1985 spectra in Figure ![[*]](http://sepwww.stanford.edu/latex2html/cross_ref_motif.gif) ,
there is no similarity in the spectra at 0.244 milli-Hz.
The event is then rejected as a possible gravitational wave signal.
Similar events were found in other years and at other
frequency ranges.
,
there is no similarity in the spectra at 0.244 milli-Hz.
The event is then rejected as a possible gravitational wave signal.
Similar events were found in other years and at other
frequency ranges.
tprspec
Figure 14 A sample of the
directionally weighted spectra for 1986 for the tapered input.
 tprspec85
Figure 15 A sample of the
directionally weighted spectra for 1985 for the tapered input.

To reduce the effect of the noise caused by the high amplitude
earthquakes and ocean noise, a gain was applied to the original data.
This equalized each station's amplitude, reduce the ocean noise, and
attenuated the earthquake events.
The directional spectra produced from these data
are shown in
Figure ![[*]](http://sepwww.stanford.edu/latex2html/cross_ref_motif.gif) .
Notice that the event at 0.244 milli-Hz is now much weaker.
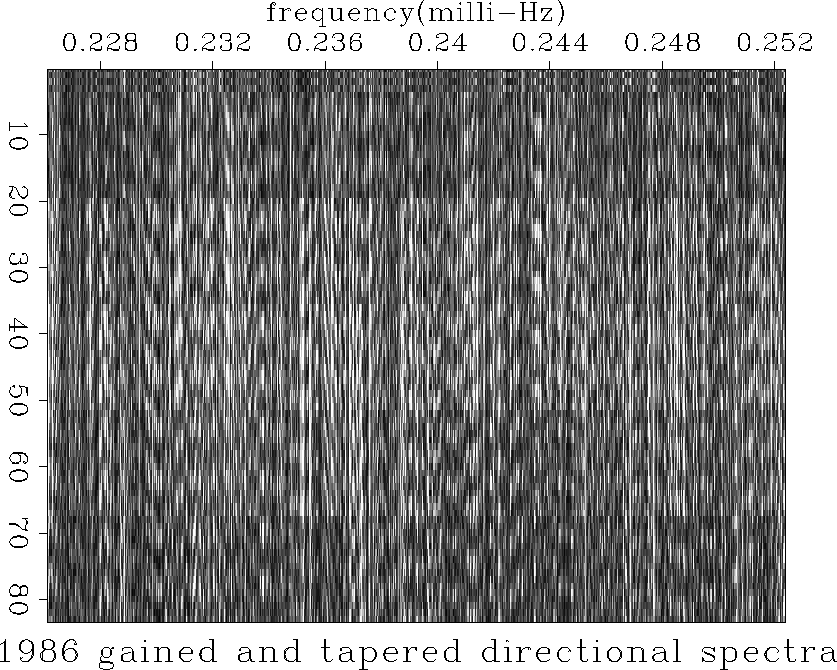
The amplitude differences between the rings of Figure
.
Notice that the event at 0.244 milli-Hz is now much weaker.
The amplitude differences between the rings of Figure ![[*]](http://sepwww.stanford.edu/latex2html/cross_ref_motif.gif) are
much less pronounced.
are
much less pronounced.
gtprspec
Figure 16 A sample of the
directionally weighted spectra for 1986 for gained and tapered input.

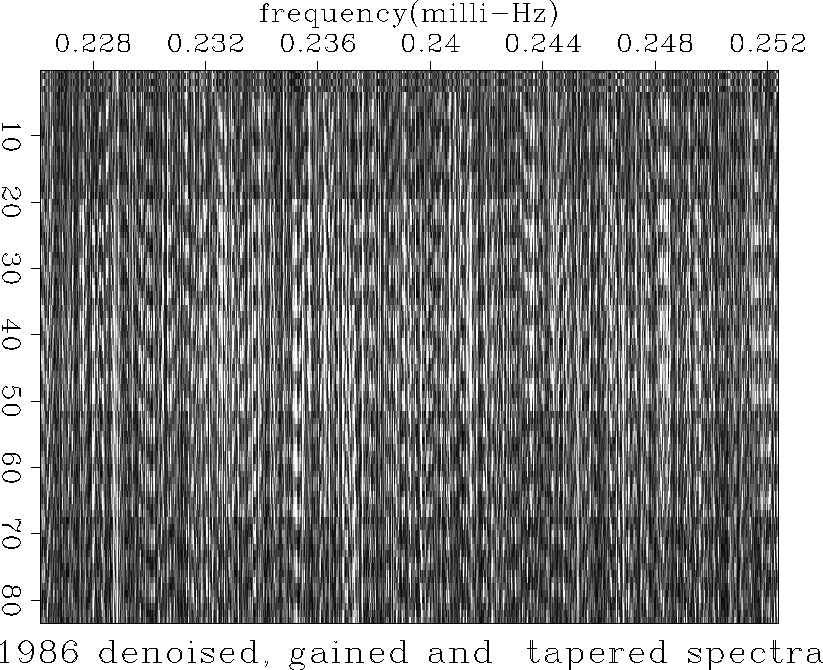
Next, the earthquake noise was removed by the process described
previously, followed by the gain and taper processes.
The spectra are now flatter and the event at 0.244 milli-Hz is even weaker.
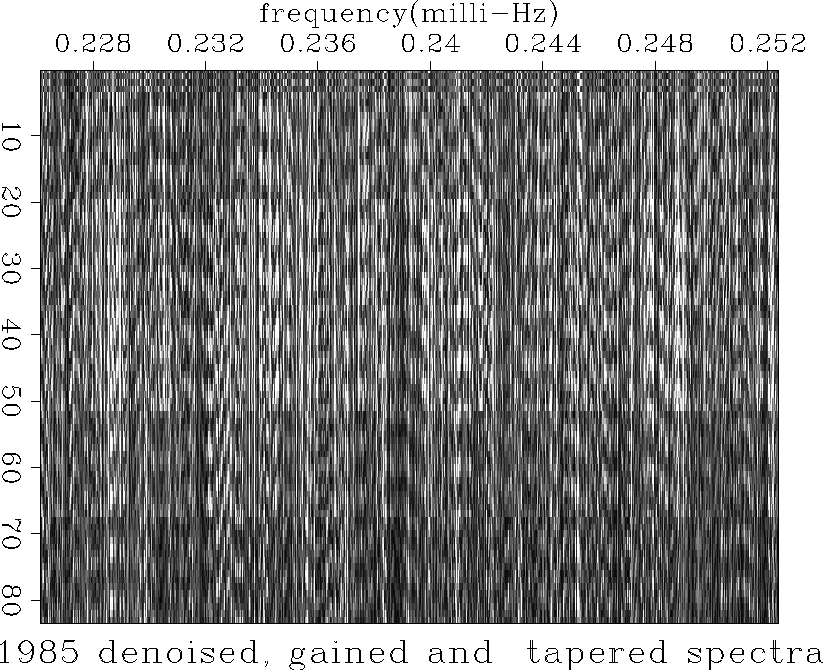
For comparison, the same frequency range is displayed in Figure ![[*]](http://sepwww.stanford.edu/latex2html/cross_ref_motif.gif) for 1985.
for 1985.
zgtspec
Figure 17 A sample of the
directionally weighted spectra for 1986 with the earthquake noise removed,
then gain and tapering applied. In the electronic version of this paper,
pushing the button will review the full range of the spectrum.
 zgtspec85
Figure 18 A sample of the
directionally weighted spectra for 1985 with the earthquake noise removed,
then gain and tapering applied. In the electronic version of this paper,
pushing the button will review the full range of the spectrum.

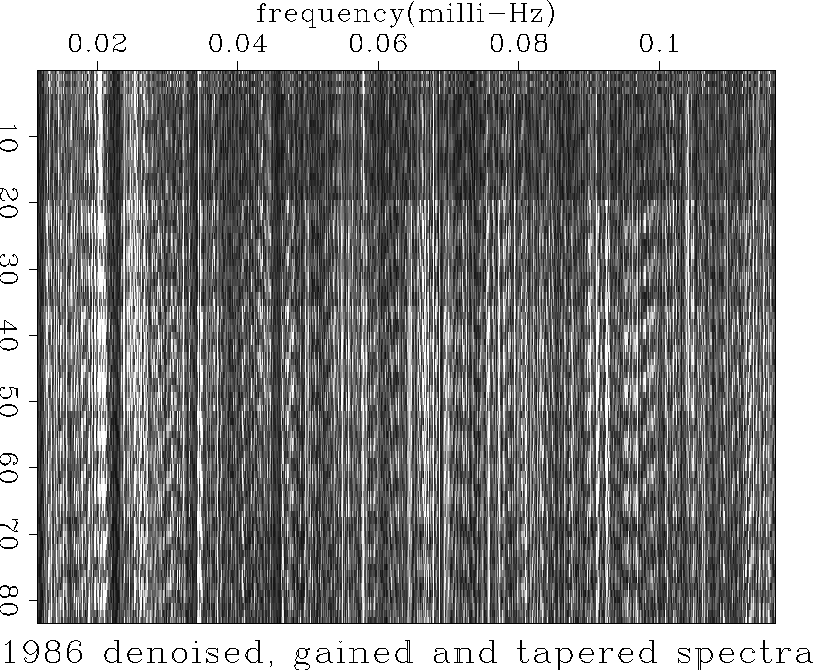
Finally, an interesting effect is seen in the low frequency part of
the directionally-weighted spectra. In Figure ![[*]](http://sepwww.stanford.edu/latex2html/cross_ref_motif.gif) a series
of events are seen spaced at 0.012 milli-Hz spacings. These correspond
to even divisors of a 24 hour period.
a series
of events are seen spaced at 0.012 milli-Hz spacings. These correspond
to even divisors of a 24 hour period.
lowfreq
Figure 19 The low-frequency part
of the 1986 directionally-weighted spectra. Notice the
events spaces at 0.012 milli-Hz intervals.


Next: POSSIBLE IMPROVEMENTS
Up: Abma: Detecting gravitational waves
Previous: PROCESSING SEQUENCE
Stanford Exploration Project
11/17/1997
![[*]](http://sepwww.stanford.edu/latex2html/cross_ref_motif.gif) is shown in Figure
is shown in Figure ![[*]](http://sepwww.stanford.edu/latex2html/cross_ref_motif.gif) .
This figure shows a set of spectra weighted to the directions shown in
Figure
.
This figure shows a set of spectra weighted to the directions shown in
Figure ![[*]](http://sepwww.stanford.edu/latex2html/cross_ref_motif.gif) by match filtering against the predicted
gravitational wave response.
Each trace number corresponds to
a direction shown on the grid in Figure
by match filtering against the predicted
gravitational wave response.
Each trace number corresponds to
a direction shown on the grid in Figure ![[*]](http://sepwww.stanford.edu/latex2html/cross_ref_motif.gif) . The spectra peak is
at 0.25 milli-Hz, and the maximum amplitude is at trace 43 as expected, but
the definition of the direction is poor.
. The spectra peak is
at 0.25 milli-Hz, and the maximum amplitude is at trace 43 as expected, but
the definition of the direction is poor.
