

Next: A 3-D example
Up: THE SPLIT-STEP FOURIER MODELING
Previous: THE SPLIT-STEP FOURIER MODELING
The 2-D velocity model in Figure ![[*]](http://sepwww.stanford.edu/latex2html/cross_ref_motif.gif) is composed of
three regions with variable velocity separated by
a dipping linear interface and a curved interface. Above
the first interface, the velocity has a horizontal and a vertical gradient.
Between the first dipping interface and the curved interface the
horizontal gradient is reversed. Under the curved interface there
is only a vertical gradient.
There is a velocity discontinuity at the location of the
dipping event and another velocity jump under the curved boundary.
The structural events are a dipping interface at the first
velocity boundary
and nine diffractors positioned at equal depth intervals.
Both modeling algorithms are implemented using absorbing
boundaries (Cerjan et al., 1985).
The size of the absorbing region is a 20 gridpoint strip
on each side of the grid.
mv
is composed of
three regions with variable velocity separated by
a dipping linear interface and a curved interface. Above
the first interface, the velocity has a horizontal and a vertical gradient.
Between the first dipping interface and the curved interface the
horizontal gradient is reversed. Under the curved interface there
is only a vertical gradient.
There is a velocity discontinuity at the location of the
dipping event and another velocity jump under the curved boundary.
The structural events are a dipping interface at the first
velocity boundary
and nine diffractors positioned at equal depth intervals.
Both modeling algorithms are implemented using absorbing
boundaries (Cerjan et al., 1985).
The size of the absorbing region is a 20 gridpoint strip
on each side of the grid.
mv
Figure 4 The 2-D reflection model and the velocity model. Velocity in the
upper layer v(x,z)=1500 + 0.8x + 0.7z (m/s),
in the intermediate layer v(x,z)=3000-0.8x+0.7z (m/s) and
in the lower layer v(x,z)=4000+0.7z (m/s).


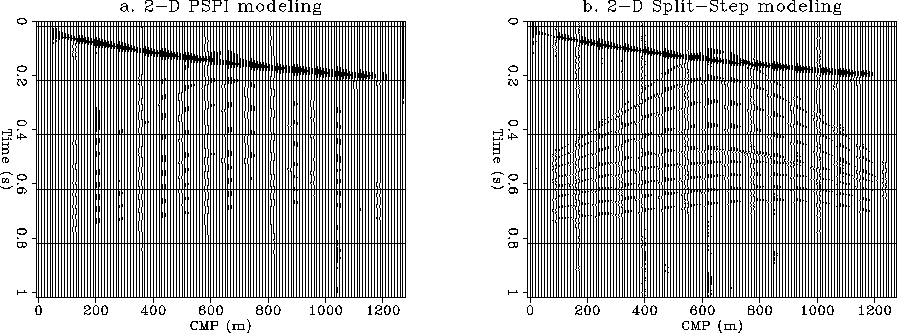
While in the migration case the PSPI appears to perform better than
Split-step in the presence of lateral velocity discontinuities,
in the modeling case I found the Split-Step algorithm to
achieve better results.
Figure ![[*]](http://sepwww.stanford.edu/latex2html/cross_ref_motif.gif) presents the results of modeling
with the two algorithms using the velocity model shown
in Figure
presents the results of modeling
with the two algorithms using the velocity model shown
in Figure ![[*]](http://sepwww.stanford.edu/latex2html/cross_ref_motif.gif) . The PSPI modeling in this figure actually
was implemented without the additional phase shift subtraction
and addition introduced by Gazdag in the original PSPI
algorithm. When using PSPI modeling, the amplitudes of the
diffractions appear weaker than in the Split-Step algorithm.
. The PSPI modeling in this figure actually
was implemented without the additional phase shift subtraction
and addition introduced by Gazdag in the original PSPI
algorithm. When using PSPI modeling, the amplitudes of the
diffractions appear weaker than in the Split-Step algorithm.
pssp2D
Figure 5 2-D comparison of the two modeling algorithms:
a. PSPI modeling. The individual diffractors
appear less defined compared to the Split-Step image.
b. Split-Step Fourier modeling.

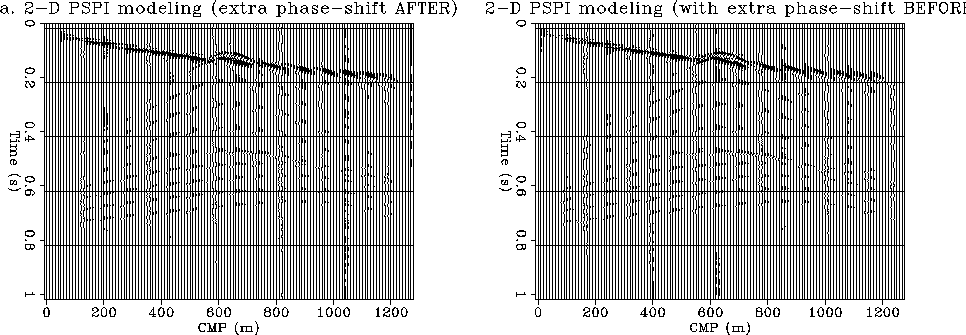
Figure ![[*]](http://sepwww.stanford.edu/latex2html/cross_ref_motif.gif) shows the results of running
PSPI modeling with the additional phase shift trick.
The difference
between the two figures is that in Figure
shows the results of running
PSPI modeling with the additional phase shift trick.
The difference
between the two figures is that in Figure ![[*]](http://sepwww.stanford.edu/latex2html/cross_ref_motif.gif) a the
extra phase-shift term from equation (11)
is applied after the upward propagation step
which corresponds to the conjugate transpose of the original
algorithm. In Figure
a the
extra phase-shift term from equation (11)
is applied after the upward propagation step
which corresponds to the conjugate transpose of the original
algorithm. In Figure ![[*]](http://sepwww.stanford.edu/latex2html/cross_ref_motif.gif) b the extra phase-shift term is
applied before the upward propagation step, which is equivalent
to applying the Gazdag trick after downward propagation in the
migration algorithm, in the
same manner as it is done in the Split-Step migration.
As seen here the two figures look almost identical.
However it appears that while the individual diffractions are
better delineated than in the simple PSPI algorithm
(without the phase-shift trick), the dipping reflector is not.
Overall the faster Split-Step appears to give better results for this
particular velocity model.
b the extra phase-shift term is
applied before the upward propagation step, which is equivalent
to applying the Gazdag trick after downward propagation in the
migration algorithm, in the
same manner as it is done in the Split-Step migration.
As seen here the two figures look almost identical.
However it appears that while the individual diffractions are
better delineated than in the simple PSPI algorithm
(without the phase-shift trick), the dipping reflector is not.
Overall the faster Split-Step appears to give better results for this
particular velocity model.
pspidv2D
Figure 6 2-D comparison of the two modeling algorithms:
a. PSPI modeling with extra phase-shift after
upward propagation.
b. PSPI modeling with extra phase-shift before upward propagation.


Next: A 3-D example
Up: THE SPLIT-STEP FOURIER MODELING
Previous: THE SPLIT-STEP FOURIER MODELING
Stanford Exploration Project
11/18/1997

![[*]](http://sepwww.stanford.edu/latex2html/cross_ref_motif.gif) is composed of
three regions with variable velocity separated by
a dipping linear interface and a curved interface. Above
the first interface, the velocity has a horizontal and a vertical gradient.
Between the first dipping interface and the curved interface the
horizontal gradient is reversed. Under the curved interface there
is only a vertical gradient.
There is a velocity discontinuity at the location of the
dipping event and another velocity jump under the curved boundary.
The structural events are a dipping interface at the first
velocity boundary
and nine diffractors positioned at equal depth intervals.
Both modeling algorithms are implemented using absorbing
boundaries (Cerjan et al., 1985).
The size of the absorbing region is a 20 gridpoint strip
on each side of the grid.
is composed of
three regions with variable velocity separated by
a dipping linear interface and a curved interface. Above
the first interface, the velocity has a horizontal and a vertical gradient.
Between the first dipping interface and the curved interface the
horizontal gradient is reversed. Under the curved interface there
is only a vertical gradient.
There is a velocity discontinuity at the location of the
dipping event and another velocity jump under the curved boundary.
The structural events are a dipping interface at the first
velocity boundary
and nine diffractors positioned at equal depth intervals.
Both modeling algorithms are implemented using absorbing
boundaries (Cerjan et al., 1985).
The size of the absorbing region is a 20 gridpoint strip
on each side of the grid.

![[*]](http://sepwww.stanford.edu/latex2html/cross_ref_motif.gif) presents the results of modeling
with the two algorithms using the velocity model shown
in Figure
presents the results of modeling
with the two algorithms using the velocity model shown
in Figure ![[*]](http://sepwww.stanford.edu/latex2html/cross_ref_motif.gif) . The PSPI modeling in this figure actually
was implemented without the additional phase shift subtraction
and addition introduced by Gazdag in the original PSPI
algorithm. When using PSPI modeling, the amplitudes of the
diffractions appear weaker than in the Split-Step algorithm.
. The PSPI modeling in this figure actually
was implemented without the additional phase shift subtraction
and addition introduced by Gazdag in the original PSPI
algorithm. When using PSPI modeling, the amplitudes of the
diffractions appear weaker than in the Split-Step algorithm.

![[*]](http://sepwww.stanford.edu/latex2html/cross_ref_motif.gif) shows the results of running
PSPI modeling with the additional phase shift trick.
The difference
between the two figures is that in Figure
shows the results of running
PSPI modeling with the additional phase shift trick.
The difference
between the two figures is that in Figure ![[*]](http://sepwww.stanford.edu/latex2html/cross_ref_motif.gif) a the
extra phase-shift term from equation (11)
is applied after the upward propagation step
which corresponds to the conjugate transpose of the original
algorithm. In Figure
a the
extra phase-shift term from equation (11)
is applied after the upward propagation step
which corresponds to the conjugate transpose of the original
algorithm. In Figure ![[*]](http://sepwww.stanford.edu/latex2html/cross_ref_motif.gif) b the extra phase-shift term is
applied before the upward propagation step, which is equivalent
to applying the Gazdag trick after downward propagation in the
migration algorithm, in the
same manner as it is done in the Split-Step migration.
As seen here the two figures look almost identical.
However it appears that while the individual diffractions are
better delineated than in the simple PSPI algorithm
(without the phase-shift trick), the dipping reflector is not.
Overall the faster Split-Step appears to give better results for this
particular velocity model.
b the extra phase-shift term is
applied before the upward propagation step, which is equivalent
to applying the Gazdag trick after downward propagation in the
migration algorithm, in the
same manner as it is done in the Split-Step migration.
As seen here the two figures look almost identical.
However it appears that while the individual diffractions are
better delineated than in the simple PSPI algorithm
(without the phase-shift trick), the dipping reflector is not.
Overall the faster Split-Step appears to give better results for this
particular velocity model.
