Next: DEALIASING BY ``STRONG'' ALIAS
Up: Nichols: Dealiasing band limited
Previous: USE OF MODEL WEIGHTING
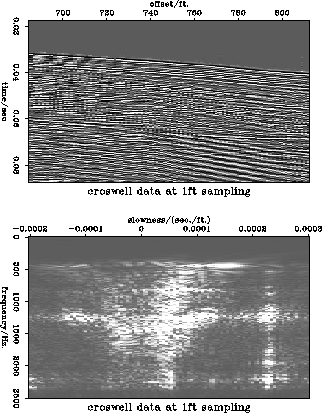
Figure ![[*]](http://sepwww.stanford.edu/latex2html/cross_ref_motif.gif) shows a real dataset. This is a crosswell dataset
sampled at one foot receiver spacing. The upper frame is the data in the
x-t domain and the lower frame is its spectrum in the
shows a real dataset. This is a crosswell dataset
sampled at one foot receiver spacing. The upper frame is the data in the
x-t domain and the lower frame is its spectrum in the  domain
calculated with a ``straight'' slant-stack. There are two distinct regions with
high energy. The large region around zero slowness corresponds to the events
with low dip and some curvature. The broad dip range is due to the curvature
along the events. The narrow region at a slowness of .00022(s/ft) corresponds
to the steeply dipping events. These events have linear moveout and thus
map to a narrow slowness band. There is no aliasing visible in this figure.
domain
calculated with a ``straight'' slant-stack. There are two distinct regions with
high energy. The large region around zero slowness corresponds to the events
with low dip and some curvature. The broad dip range is due to the curvature
along the events. The narrow region at a slowness of .00022(s/ft) corresponds
to the steeply dipping events. These events have linear moveout and thus
map to a narrow slowness band. There is no aliasing visible in this figure.
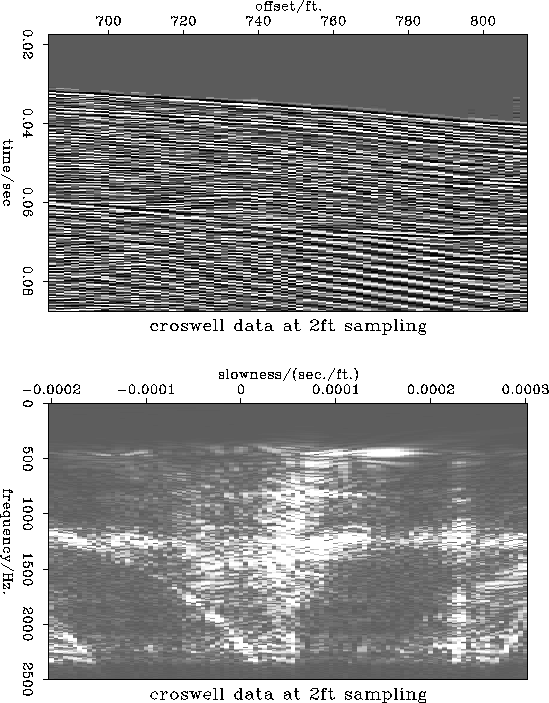
Figure shows the same two figures after every other input
trace is removed. At this input spacing the data is aliased at high
frequencies. The alias of the tube wave that crosses zero slowness at
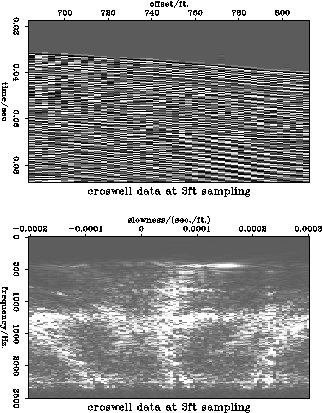
about 2200Hz is particularly obvious. Figure shows the same
two frames when the data is sampled at three times the original trace
spacing (three feet). At this trace spacing the data is aliased over
the whole of the top half of the signal bandwidth.
real-orig
Figure 14 Crosswell data sampled at a one foot receiver interval. Top frame is the x-t data, bottom frame is the data.


 real-sub2
Figure 15 Crosswell data sampled at a two foot receiver interval. Top frame is the x-t data, bottom frame is the data.Aliasing occurs above 1500Hz.
real-sub3
Figure 16 Crosswell data sampled at a three foot receiver interval. Top frame is the x-t data, bottom frame is the data. Aliasing occurs above 750Hz.
Next: DEALIASING BY ``STRONG'' ALIAS
Up: Nichols: Dealiasing band limited
Previous: USE OF MODEL WEIGHTING
Stanford Exploration Project
11/18/1997