 |
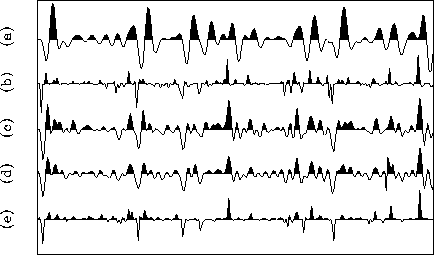
Figure 8 (a) Original trace and (b) original reflectivity series. The other traces correspond to the results of (c) predictive decon, (d) convolution with the inverse-wavelet filter, (e) and ICP decon.
It is important to mention that the final solution depends not so much on the initial form of the wavelet, but on its initial phase. For the examples in Figures 8 and 9 the same final solution was reached when a delayed spike was used as the initial wavelet, as long as the delay was equal to the lag of the absolute maximum of the used wavelet.
The iterative algorithm described by equation (17) was applied to the same synthetic trace of the previous sections. Figure 8 compares the results of three different deconvolution approachs: predictive decon (c); ICP decon using the minimum-phase wavelet corresponding to a smoothed version of the trace spectrum (e); and convolution with the inverse filter of the same minimum-phase wavelet (d). As we should expect, (c) and (d) are very similar because both methods are linear, and while one uses a minimum-phase wavelet, the other implicitly assumes the wavelet to be minimum-phase. Here again the ICP decon provides the sharper version of the reflectivity sequence since it keeps the same frequency distribution as the original series.
 |
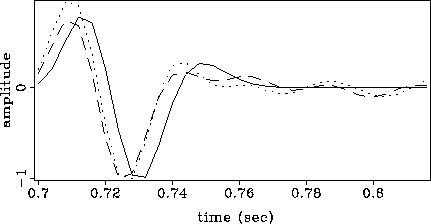
Figure 9 compares the true wavelet with the initial and final wavelets corresponding to the application of the ICP decon to the trace of Figure 8. The final estimated wavelet resembles the true wavelet, except by a constant time-shift, and some small oscillations on the tail.
 |
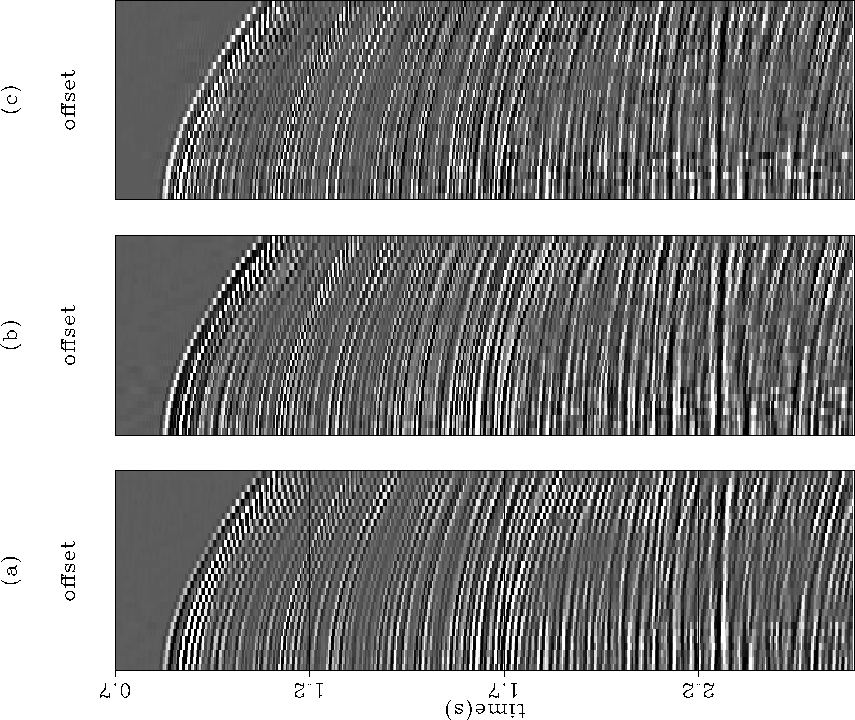
Finally, I applied the ICP decon to a CMP gather recorded for British Petroleum in a deep-water environment of Alaska off-shore. Figure 10 shows (a) the unprocessed CMP gather, (b) the same data after predictive deconvolution, and (c) after the ICP deconvolution. The two deconvolution results are very similar, except by a slightly improved sharpness of the ICP deconvolution, as can be observed in the two reflections between 1.2 and 1.3 seconds; in (a) it is not possible to resolve the polarity of the reflections, while in (b) they were reduced to two main white events with small black side-lobs, and in (c) the black side-lobs have almost disappeared. We can also notice that in (c) the ocean floor reflection was also reduced to a single white event, without the black successor that appear in (a) and (b).
I plan next, to extend the method to works in a multi-channel basis. Possible advantages of this extension are an improvement in the stability of the process, and an a more consistent estimation of the wavelet.
 |