Next: Anisotropic migration velocity analysis
Up: Anisotropic migration velocity analysis
Previous: Estimation of the horizontal
Eventually, we illustrate the caveats in the computation of
anisotropic velocity spectra and demonstrate that as few
approximations as possible should be made in order to attain accurate
anisotropic parameter estimates.
As equation 5 shows, the predicted RMO is a
function of both phase and group aperture angles. Phase aperture angles are
computed by applying post-processing slant-stacks on the prestack
migrated image (equation 3). Group aperture
angles have to be derived from phase aperture angles.
Figure ![[*]](http://sepwww.stanford.edu/latex2html/cross_ref_motif.gif) illustrates the velocity
spectra computed when approximating the group aperture angles with the
phase aperture angles. It shows the inaccuracy of the estimates of the
anisotropic parameters for large velocity perturbations.
Figure illustrates the velocity
spectra computed when the first-order derivatives in
equation 5 are computed around the migration
velocity model and not the velocity model whose semblance
we compute. The group aperture angles are computed from phase aperture
angles using equation 11.
Figure illustrates the
inaccuracy of the anisotropic parameter estimates for large velocity
perturbations.
It indicates that when computing velocity model semblances,
first-order derivatives of the RMO functions have to be estimated
independently for each velocity model.
Comb-VelSpec-phase_centrd
illustrates the velocity
spectra computed when approximating the group aperture angles with the
phase aperture angles. It shows the inaccuracy of the estimates of the
anisotropic parameters for large velocity perturbations.
Figure illustrates the velocity
spectra computed when the first-order derivatives in
equation 5 are computed around the migration
velocity model and not the velocity model whose semblance
we compute. The group aperture angles are computed from phase aperture
angles using equation 11.
Figure illustrates the
inaccuracy of the anisotropic parameter estimates for large velocity
perturbations.
It indicates that when computing velocity model semblances,
first-order derivatives of the RMO functions have to be estimated
independently for each velocity model.
Comb-VelSpec-phase_centrd
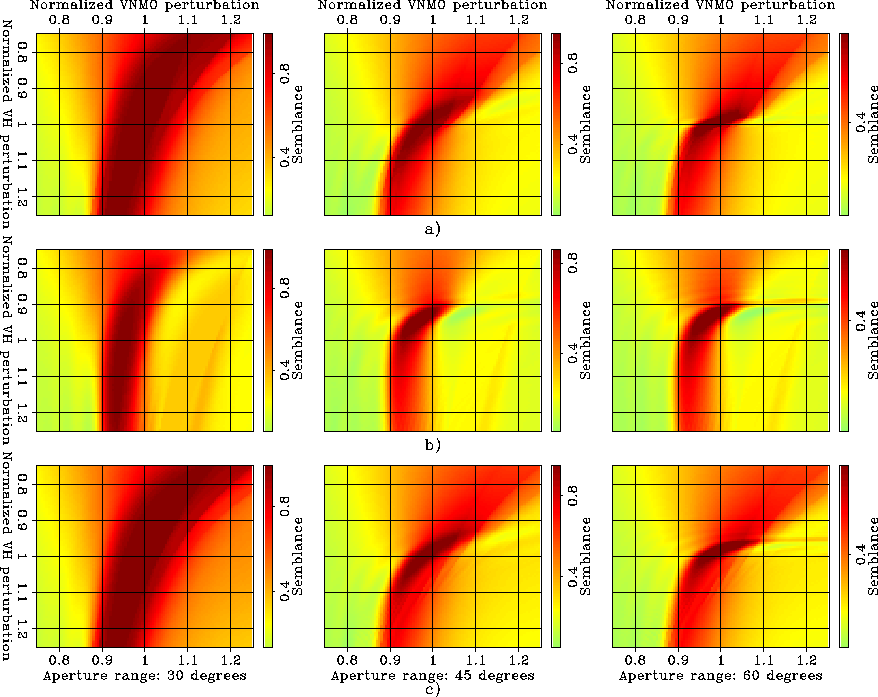
Figure 5
Velocity spectra obtained when the group aperture angles are
approximated as equal to the phase aperture angles. The data have
been modeled with a constant anisotropic velocity model (Taylor
Sand) and then migrated using: a) a velocity uniformly perturbed by
 , b) a velocity uniformly perturbed by
  , and c) an isotropic velocity with the correct vertical velocity. The
different semblance panels are computed for different ranges of
aperture angles (
, and c) an isotropic velocity with the correct vertical velocity. The
different semblance panels are computed for different ranges of
aperture angles ( ,
,  and
and  , from
left to right). The parameterization of the estimated anisotropic
velocity model is done with
, from
left to right). The parameterization of the estimated anisotropic
velocity model is done with  and
and  normalized by
the correct perturbation values.
normalized by
the correct perturbation values.


Comb-VelSpec-group_approx_centrd
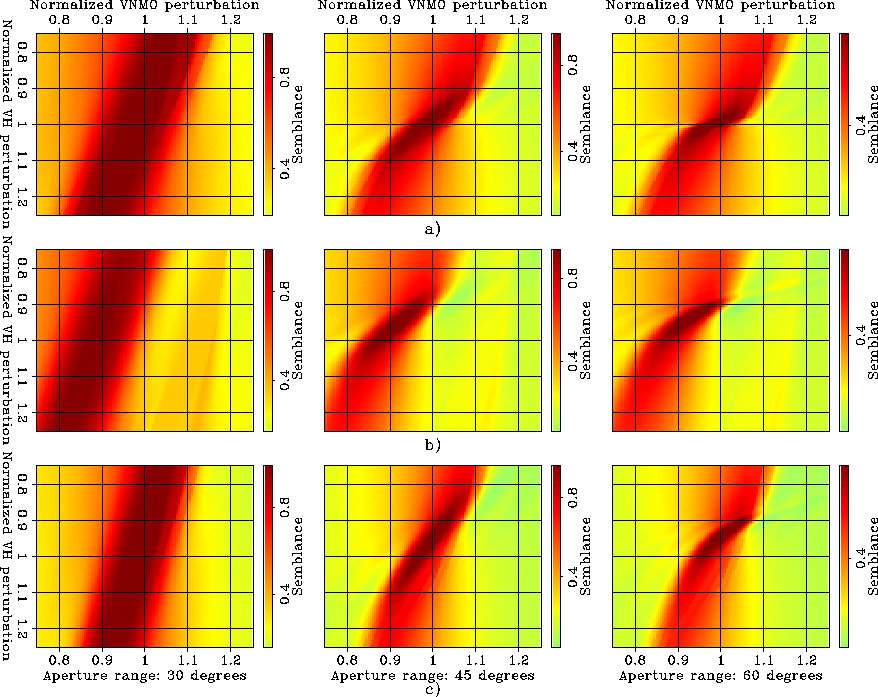
Figure 6
Velocity spectra obtained when the first-order derivatives in
equation 5 are computed around the migration
velocity model. The group aperture angles are computed from phase aperture
angles using equation 11. The data have
been modeled with a constant anisotropic velocity model (Taylor
Sand) and then migrated using: a) a velocity uniformly perturbed by
, b) a velocity uniformly perturbed by , and c) an isotropic velocity with the correct vertical velocity. The
different semblance panels are computed for different ranges of
aperture angles (, and , from
left to right). The parameterization of the estimated anisotropic
velocity model is done with and , normalized by
the correct perturbation values.
Next: Anisotropic migration velocity analysis
Up: Anisotropic migration velocity analysis
Previous: Estimation of the horizontal
Stanford Exploration Project
5/6/2007