

Next: CONCLUSIONS
Up: Berryman: Geomechanical analysis with
Previous: UP-SCALING MODEL FOR GEOMECHANICS
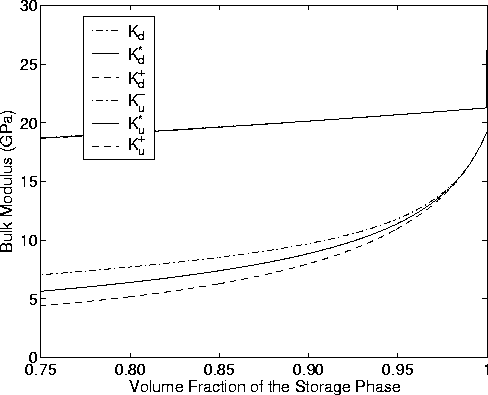
weberK
Figure 3
Bulk modulus bounds and self-consistent estimates for the
random polycrystal of porous laminates model of a Weber sandstone
reservoir.
|
|  |

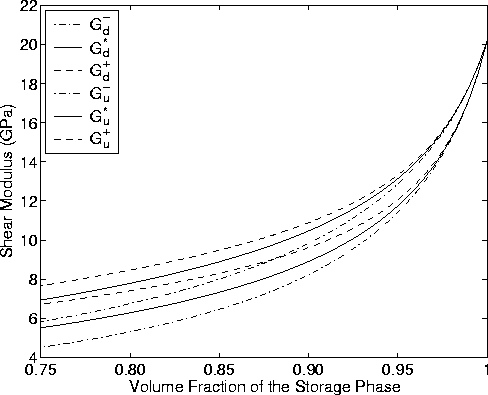
weberG
Figure 4
Shear modulus bounds and self-consistent estimates for the
random polycrystal of porous laminates model of a Weber sandstone
reservoir.
|
|  |

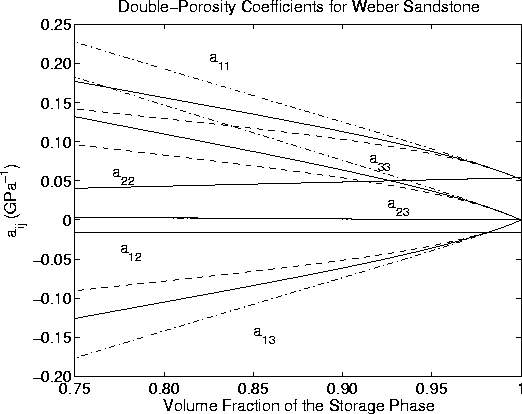
weberaij
Figure 5
Values of double-porosity coefficients aij for a system
similar to Weber sandstone. Values used for the input parameters are
listed in TABLE 1. For each coefficient, three curves are shown,
depending on which estimate of the overall bulk modulus is used:
lower bound (dot-dash line), self-consistent (solid line),
or upper bound (dashed line).
|
|  |

Weber sandstone is one possible host rock for which the required
elastic constants have been measured by Coyner (1984). TABLE 1 displays the values needed in the double-porosity theory
presented here. These values follow from an analysis of
Coyner's data if I assume the stiffer phase occupies about 92%
of the volume and the more compliant phase the remaining 8% of total volume.
The drained bulk moduli of the storage and fracture
phases are used in the effective medium theory of the previous section
to determine the overall drained and undrained
bulk moduli of the random polycrystal of laminates system.
Results for the self-consistent estimates (Berryman, 2004b),
and the upper and lower bounds for the bulk moduli
are all displayed in Figure 3. I see the undrained moduli are nearly
indistinguishable, but the drained constants show some dispersion.
Similarly, I show bounds and self-consistent estimates for the overall
shear modulus of this model reservoir in Figure 4. Both undrained and
drained shear moduli show some dispersion.
Note that a correction must be applied to (31)
before computing the self-consistent effective constants.
The self-consistent estimates for bulk modulus are found correctly
from the bounds (26) by taking
 ,
,  , and therefore
 . The resulting formula is
|  |
(33) |
The self-consistent formula for shear modulus requires more effort.
The difficulty is that the formula given in (31)
has already made use of a constraint that is only true along the
bounding curves defining the upper and lower bounds on shear modulus.
Since the self-consistent estimate always falls at points away
from this curve, a more general result must be employed. When
the inappropriate constraint is replaced by the general formula
and then (33) is substituted, I find instead that
the self-consistent formula for shear modulus is given by
|  |
(34) |
where  . The main difference is
that the denominator of the first term on
the right hand side is simpler than it is in the formulas
for the shear modulus bounds.
Observed dispersion is small over the range of volume fractions considered.
Then these drained values Kd*,
  are used in
the formulas of the second section to determine both estimates and bounds on
the double-porosity coefficients. These results are then displayed in
Figure 5, which is also the main result of this paper. Note that the
curves for a11 essentially repeat results shown in Figure 3, but
for the compliance 1/Kd*, instead of the stiffness Kd*.
The coefficients a12, a22, and a23 show little
dispersion. This is natural for a12 and a22 because
the storage material contains no fractures, and therefore is not
sensitive to fracture compliance, whereas those mechanical effects
on the overall reservoir response can be very large. The behavior
of a23 also shows little dispersion as this value is always very
close to zero (Berryman and Wang, 1995; Berryman and Pride, 2002).
The two remaining
coefficients show a significant level of dispersion are
a13 and a33, where the third stress is the pore pressure
pf(2) of the fracture or joint phase.
I generally expect that the joint phase is most
tightly coupled to, and therefore most sensitive to, the fluctuations
in overall drained bulk modulus Kd*. So all these results are
qualitatively consistent with our intuition.
Since I have analytical formulas for all the aij's, it is
straightforward to check that the observed dispersion in a13 and
a33 is directly proportional to the dispersion in
1/Kd* (or, equivalently, a11).


Next: CONCLUSIONS
Up: Berryman: Geomechanical analysis with
Previous: UP-SCALING MODEL FOR GEOMECHANICS
Stanford Exploration Project
10/31/2005


![]() ,
, ![]() , and therefore
, and therefore
![]() . The resulting formula is
. The resulting formula is