|
sg-fold
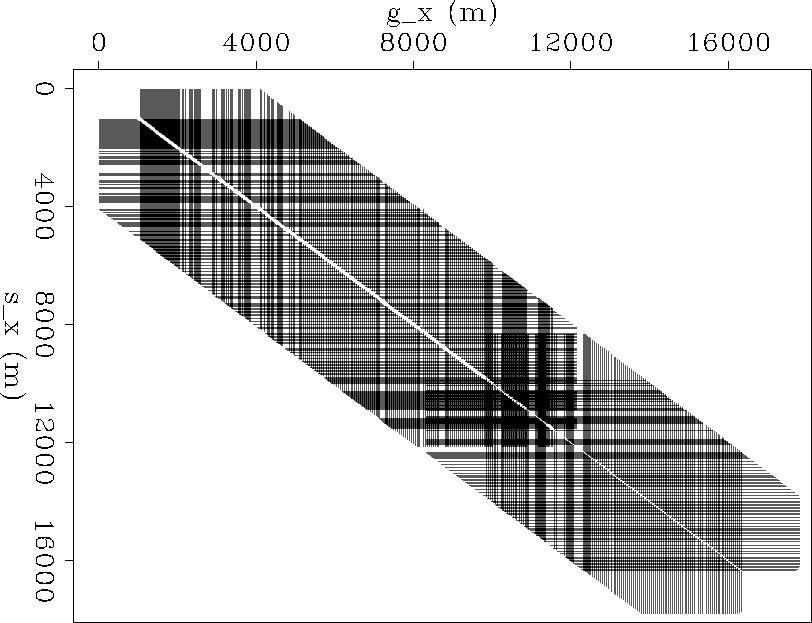
Figure 1 A map of source and receiver positions. Receivers are well-sampled, as shown in the horizontal axis. The source sampling is irregular, as seen in the vertical axis.. |  |
![[*]](http://sepwww.stanford.edu/latex2html/cross_ref_motif.gif) .
.
|
sg-fold
Figure 1 A map of source and receiver positions. Receivers are well-sampled, as shown in the horizontal axis. The source sampling is irregular, as seen in the vertical axis.. |  |
As seen in the figure, there is almost no irregularity in the receiver positions, excluding the lack of very near offsets. However, the source positions in the survey are quite irregular, as shown by the gaps in the vertical axis.
When examining the spatial distribution of the data in cmp and offset
coordinates (Figure ![[*]](http://sepwww.stanford.edu/latex2html/cross_ref_motif.gif) ), the irregularity of the source
positions can be seen in both the cmp and offset positions. In Figure
), the irregularity of the source
positions can be seen in both the cmp and offset positions. In Figure
![[*]](http://sepwww.stanford.edu/latex2html/cross_ref_motif.gif) , the data are shown in cmp and absolute offset
coordinates, as the sign of the offset of a trace is unimportant
if reciprocity is assumed.
, the data are shown in cmp and absolute offset
coordinates, as the sign of the offset of a trace is unimportant
if reciprocity is assumed.
|
co-fold
Figure 2 A map of midpoint and absolute offset positions. The split spread is shown by the two different orientations of a receiver line, one for the positive offsets and another for the negative offsets. The irregularity in sources leads to gaps in both directions. |  |
The receiver cables that appear as horizontal lines in Figure
![[*]](http://sepwww.stanford.edu/latex2html/cross_ref_motif.gif) now appear as diagonal lines in cmp-absolute offset space.
However, since this is split-spread land data, the negative offsets
appear as diagonal lines running orthogonal to the positive offsets,
with the 'reflecting point' of this line occurring at zero absolute
offset.
now appear as diagonal lines in cmp-absolute offset space.
However, since this is split-spread land data, the negative offsets
appear as diagonal lines running orthogonal to the positive offsets,
with the 'reflecting point' of this line occurring at zero absolute
offset.
The orthogonal tracks caused by the split-spread acquisition are very
reminiscent of the crossing tracks shown in the Madagascar satellite
dataset Ecker and Berlioux (1995). It is possible that methods being
developed for this data would also be applicable to split-spread land
data. When looking at the spatial distribution of this land data in
source-receiver coordinates and by adding a second set of traces
predicted by reciprocity, two sets of crossing horizontal and vertical
lines can be observed, shown in Figure ![[*]](http://sepwww.stanford.edu/latex2html/cross_ref_motif.gif) .
.
|
sg-rec-fold
Figure 3 A map of source and receiver positions, including a second set of traces predicted by reciprocity. This second set intersects with the first set because both positive and negative offsets are present. |  |
A window was selected from both the cmp-absolute offset and the
source-receiver cube, that was ![]() both for both display
and computational concerns. The two cubes are somewhat co-located,
and contain small as well as large gaps. In both domains a 3D
non-stationary
both for both display
and computational concerns. The two cubes are somewhat co-located,
and contain small as well as large gaps. In both domains a 3D
non-stationary ![]() coefficient PEF was estimated with 5
scales of data. The filter had micropatches Crawley (2000)
of size
coefficient PEF was estimated with 5
scales of data. The filter had micropatches Crawley (2000)
of size ![]() , Laplacian regularization with an identical
, Laplacian regularization with an identical
![]() , and 100 iterations of a
conjugate-gradient solver were used to estimate the PEFs.
, and 100 iterations of a
conjugate-gradient solver were used to estimate the PEFs.
For the second stage of the interpolation (after the PEF has been estimated), fitting goals (2) were solved in each domains with 100 iterations of a conjugate-gradient solver.
 |
![[*]](http://sepwww.stanford.edu/latex2html/movie.gif)
The results from the cmp-absolute offset domain interpolation are
shown in Figure ![[*]](http://sepwww.stanford.edu/latex2html/cross_ref_motif.gif) . The interpolation is quite
successful. While in the common offset section there does not appear
to be that many discernible features to interpolate, the cmp gather has multiple
simultaneous dips (some steep) that are interpolated correctly, as well as a range
of gap sizes.
. The interpolation is quite
successful. While in the common offset section there does not appear
to be that many discernible features to interpolate, the cmp gather has multiple
simultaneous dips (some steep) that are interpolated correctly, as well as a range
of gap sizes.
 |
![[*]](http://sepwww.stanford.edu/latex2html/movie.gif)
The results of the interpolation in source-receiver coordinates are
shown in Figure ![[*]](http://sepwww.stanford.edu/latex2html/cross_ref_motif.gif) . In this domain, absent sources
appear as empty boxes within the data cube, whereas the same holes are
roughly diamond-shaped in cmp-absolute offset space. The interpolated
results are acceptable, but are not as impressive as those in
cmp-absolute offset space. This could be because of the distribution
of the data, and the fact that the square-shaped holes would lead to
coarser scales of data dominating the estimation in source-receiver
coordinates compared to cmp-absolute offset coordinates.
. In this domain, absent sources
appear as empty boxes within the data cube, whereas the same holes are
roughly diamond-shaped in cmp-absolute offset space. The interpolated
results are acceptable, but are not as impressive as those in
cmp-absolute offset space. This could be because of the distribution
of the data, and the fact that the square-shaped holes would lead to
coarser scales of data dominating the estimation in source-receiver
coordinates compared to cmp-absolute offset coordinates.