| |
(32) |
| |
(33) |
| |
(34) |
Consider a simple, real, even signal
such as (b-1, b0, b1) = (1, 0, 1).
Its transform
![]() is an even function of
is an even function of
![]() , since
, since ![]() .
.
Consider the real, odd signal (b-1, b0, b1) = (-1, 0, 1).
Its transform ![]() is imaginary and odd,
since
is imaginary and odd,
since ![]() .
.
Likewise, the transform of the imaginary even function (i, 0, i)
is the imaginary even function ![]() .Finally, the transform of the imaginary odd function (-i, 0, i)
is real and odd.
.Finally, the transform of the imaginary odd function (-i, 0, i)
is real and odd.
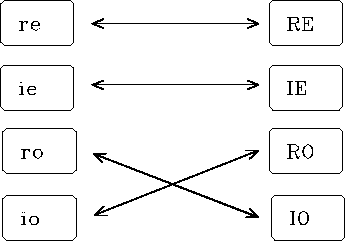
Let r and i refer to real and imaginary, e and o to even and odd, and lower-case and upper-case letters to time and frequency functions. A summary of the symmetries of Fourier transform is shown in Figure 10.
|
reRE
Figure 10 Odd functions swap real and imaginary. Even functions do not get mixed up with complex numbers. |  |
More elaborate signals can be made
by adding together the three-point functions we have considered.
Since sums of even functions are even,
and so on,
the diagram in Figure 10
applies to all signals.
An arbitrary signal is made from these four parts only,
i.e., the function has the form
![]() .On transformation of bt,
each of the four individual parts transforms according to the table.
.On transformation of bt,
each of the four individual parts transforms according to the table.
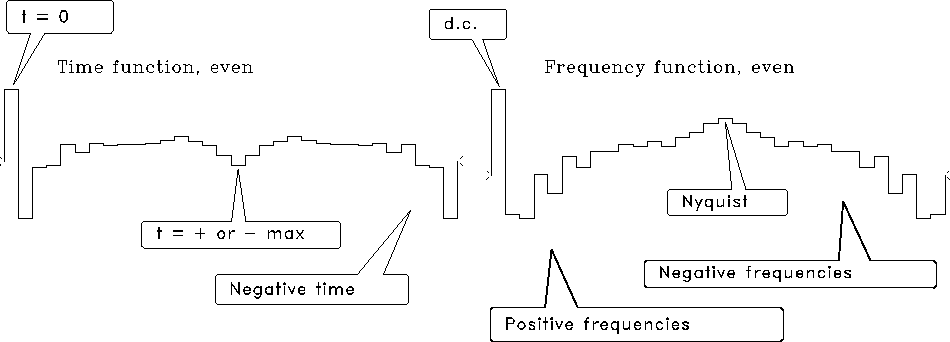
Most ``industry standard'' methods of Fourier transform set the zero frequency as the first element in the vector array holding the transformed signal, as implied by equation (26). This is a little inconvenient, as we saw a few pages back. The Nyquist frequency is then the first point past the middle of the even-length array, and the negative frequencies lie beyond. Figure 11 shows an example of an even function as it is customarily stored.
 |
http://sepwww.stanford.edu/oldsep/hale/FftLab.html
which contains the interactive Java FT laboratory written by Dave Hale. This program applies equations (26) and (27).