

Next: Conclusions
Up: Alkhalifah & Fomel: Fast
Previous: Numerical Tests
When the phrase complex media is used, the Marmousi model often comes to mind.
The huge amount of folding and faulting induced in this model have
created a rather interesting distribution of
velocity anomalies and discontinuities.
As a result, the Marmousi model has served as a performance measure used
to evaluate various migration
and traveltime calculation algorithms. In this section, we use the unsmoothed version of the Marmousi model
to test the fast marching methods accuracy and stability. The lateral grid spacing
was reduced to obtain a more efficient finite-difference solution of the acoustic wave equation, for
comparison. Because the second-order scheme
van Trier and Symes (1991), even with the adaptive measures, is not stable
in such a complex model, we use a version of the fast marching
eikonal solver, implemented
on a very fine grid in polar coordinates to reduce the first-order
traveltime derivate errors. The solution of this fine-grid implementation
will serve as a reference
used to compare the accuracies of Cartesian versus polar coordinate implementation of the method on a more
practical grid spacing.
vtcontleg
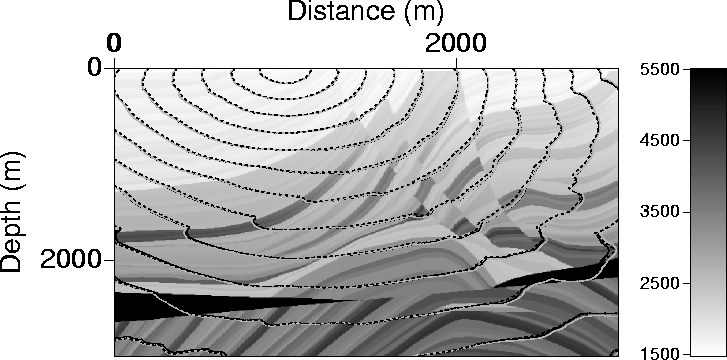
Figure 9 Contours of traveltimes in the Marmousi model
caused by a source placed on the surface
at a distance of 1000 m.
The solid black curves correspond to the solution of the fast marching
method implemented using a very fine grid (the reference solution). The dashed
curves correspond to use of the fast marching
solver in Cartesian coordinates; the gray curves,
in polar coordinates. While the solid black and gray curves
are close overall, the dashed curve corresponding to the Cartesian coordinate implementation has problems,
especially near 45-degree wave propagation. In the background is the Marmousi velocity model described
in m/s units.

Figure 9 shows contours of traveltime using the fast marching
method in Cartesian coordinates
(dashed curves), and in polar coordinates (gray curves). The black curves show traveltimes for the
more accurate reference solution based on a fine-grid implementation.
For vertical and horizontal wave propagation, the various
contours practically overlap. At a near 45-degree angular wave propagation,
the dashed curves tend to predict
faster times than the actual solution. In some regions,
the polar coordinate implementation may give the worse results,
for example, at distance 3000 m and depth 2000 m, but, overall, fast marching in polar coordinates
gives better results than the Cartesian-coordinate implementation
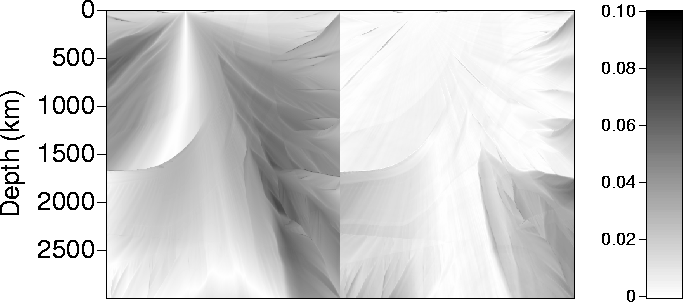
as Figure 10 shows.
Both methods were executed on a 200MHz Pentuim processor
and took less than two seconds of computer time.
diffvxzlmarmo1000
Figure 10 As in Figure 8 (bottom),
but for the Marmousi model,
the
absolute difference, or errors, in seconds between traveltime calculated by
the fast marching method using the Cartesian coordinates (left) in comparison to the
polar coordinates (right) and the more accurate, finer grid implementation.
 tcont10
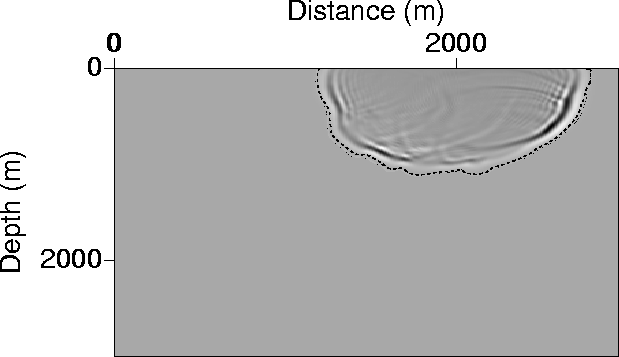
Figure 11 The one-second contour curves
from Figure 9 laid over
the finite-difference solution of the acoustic wave equation
at time one second resulting from a source placed at the surface
at 1000 m distance, and ignited as causal ricker wavelet at zero seconds.
The contour curves nicely envelope the wave energy for almost all angles.

Figure 11 shows the one-second contour curves superimposed on a snapshot of the finite difference
solution of the acoustic wave equation at time one second caused by a source at time zero.
The source is a ricker wavelet
that starts at zero time with the peak value slightly delayed.
As a result, the curves act as an envelope for the
energy propagation, which in this case, matches most of the more energetic waves. (Later in this section,
we show examples
in which the most energetic waves are not necessarily the fastest predicted by the eikonal solver,
and as a result the eikonal solution does not
provide the desired solution.)
vtcont2000
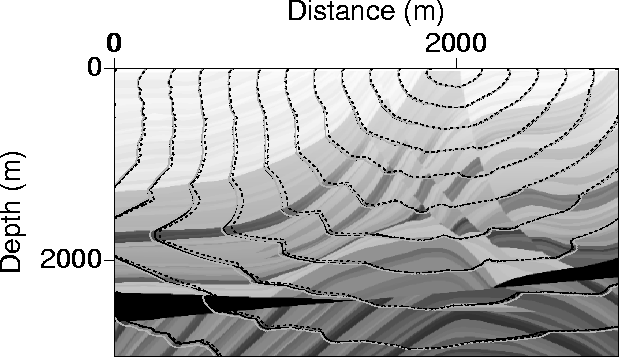
Figure 12 Contours of traveltimes in the Marmousi model
resulting from a source placed on the surface above a more complicated region;
at distance 2000 m.
The solid black curves correspond to the solution of the fast marching method at a
very fine grid--the reference solution. The dashed
curves correspond to use of the fast marching eikonal solver
in Cartesian coordinates; the gray curves,
in polar coordinates.
While the solid black and gray curves
are close overall, the dashed curve corresponding to the Cartesian coordinate solution again has problems
near 45-degree wave propagation.

Figure 12 shows contours of traveltime
using the fast marching method in Cartesian coordinates
(dashed curves) and
in polar coordinates (gray curves). The black curves show traveltimes
for the
more accurate reference solution. The source is placed above a complicated region of the
Marmousi, which causes multi-arrival traveltimes. For vertical and horizontal
wave propagation, the various
contour curves practically coincide.
At near 45-degree angular wave propagation, the dashed curves, which are the result
of the Cartesian coordinate implementation, provide quite inaccurate traveltimes
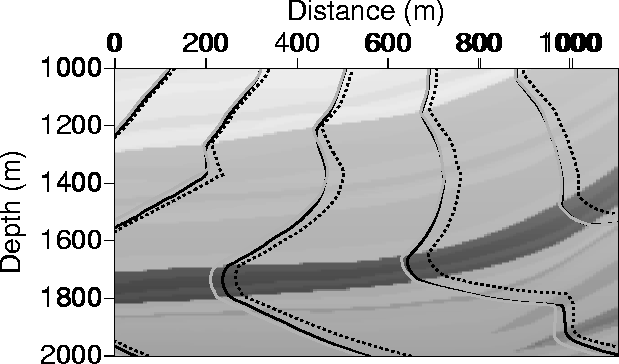
(see Figure 13). A closer look,
given by Figure 14, reveals how much the Cartesian coordinate implementation hampered
the results. The errors are as large as three percent
in this area, which is clearly unacceptable.
Finer grid coverage in the Cartesian-coordinate implementation
will reduce such errors, but at a higher computational cost.
At the same computational cost, the polar coordinate
implementation of the fast marching method provides far
better results even in complex models.
diffvxzlmarmo
Figure 13 As in Figure 10,
but with the source at 2000 m distance, the
absolute difference, or errors, in seconds between traveltime calculated by
the fast marching method using the Cartesian coordinates (left) and the
polar coordinates (right) in comparison with the more accurate, finer grid implementation.
 vtcont2000c
Figure 14 A detail of Figure 12 that demonstrates
the accuracy of the polar coordinate solution given by the gray curves as opposed to the Cartesian one
given by the dashed curves. The reference solution is indicated by the black curve.

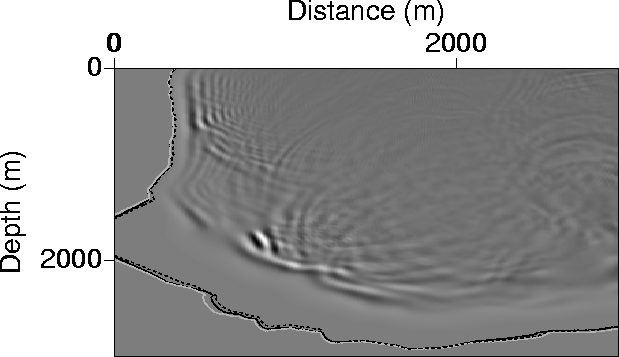
Figure 15 shows the 0.5 second contour curves superimposed on a snapshot
of the finite difference
solution of the acoustic wave equation at time 0.5 seconds caused by a source at time zero. The source is
above a complicated area of the Marmousi model and some evidence of the departure of the eikonal solution
from the most energetic solutions appears, especially for waves traveling vertically. A snapshot
at later time, one second, (Figure 16) shows how much the
eikonal solution departed from the most energetic solution. This departure
results in less than desirable traveltimes when using the eikonal solution for a process like migration.
However, this is the price we pay for such a highly efficient method of calculating traveltimes.
tcont5-2000
Figure 15 The 0.5 second contour curves from
Figure 12 laid over
the finite-difference solution of the acoustic wave
equation at time 0.5 seconds, caused by a source placed at the surface
at 2000 m distance, and ignited as a causal ricker wavelet at zero seconds.
The contour curves nicely envelope the wave energy at this early time for almost all angles.
 tcont10-2000
Figure 16 The one-second contour curves of
Figure 12 laid over
the finite-difference solution of the acoustic wave equation
at time one second, caused by a source placed at the surface
at 2000 m distance, and ignited as a causal ricker wavelet at zero seconds.
In complex media, the fastest propagating
energy is not necessarily the most energetic.

The above examples demonstrate that for an algorithm of the same cost,
the accuracy of the polar (or spherical) implementation
of the fast marching eikonal solver is far superior to the Cartesian version, even in
complex models. Both methods are
unconditionally stable with no limitations imposed on the
direction of the wavefront propagation. Also, while the eikonal
solver may provide reasonable solutions in some areas of the Marmousi models, the complexity of other
areas results in less than optimal results.


Next: Conclusions
Up: Alkhalifah & Fomel: Fast
Previous: Numerical Tests
Stanford Exploration Project
10/9/1997
