We have used the SEG-EAGE salt model to test the interpolation method on a
more complex velocity distribution. The model is defined in a grid of
![]() m. To ensure a smooth distribution of the rays, we have smoothed the
model using a
m. To ensure a smooth distribution of the rays, we have smoothed the
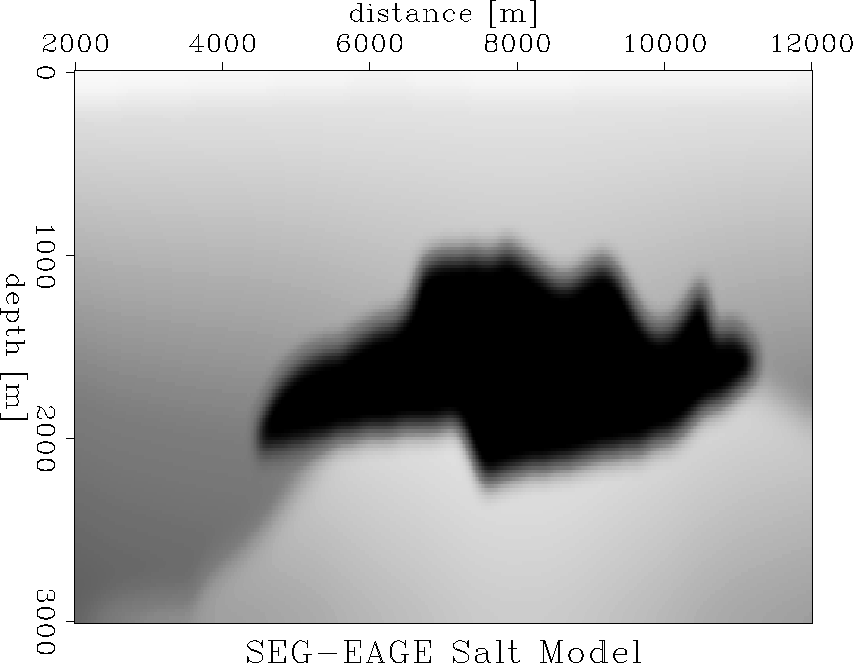
model using a ![]() triangular filter (Figure 6). The
source is placed on the surface at X=7000 m.
triangular filter (Figure 6). The
source is placed on the surface at X=7000 m.
|
s-velocity
Figure 6 The smoothed SEG-EAGE salt model. |  |
 |
 |
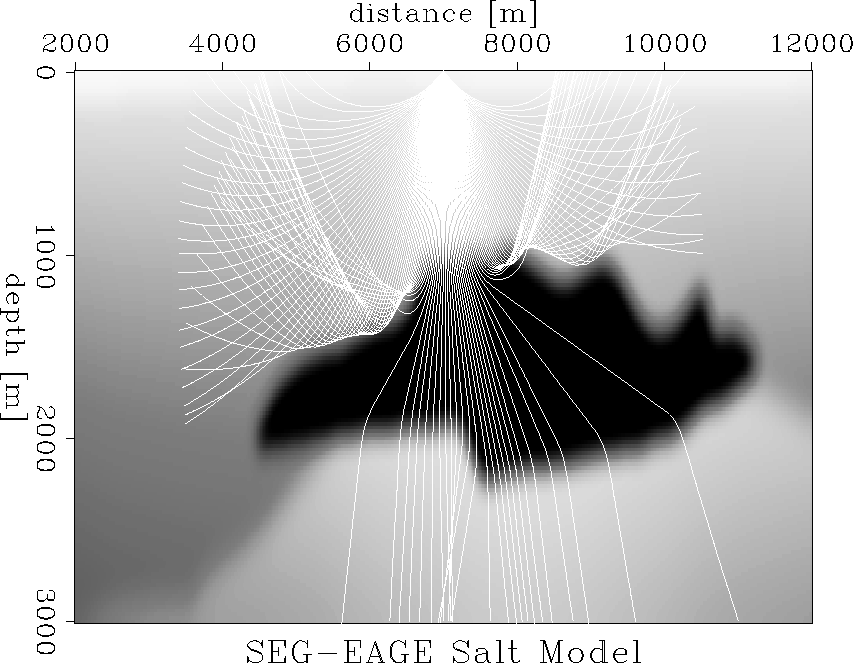
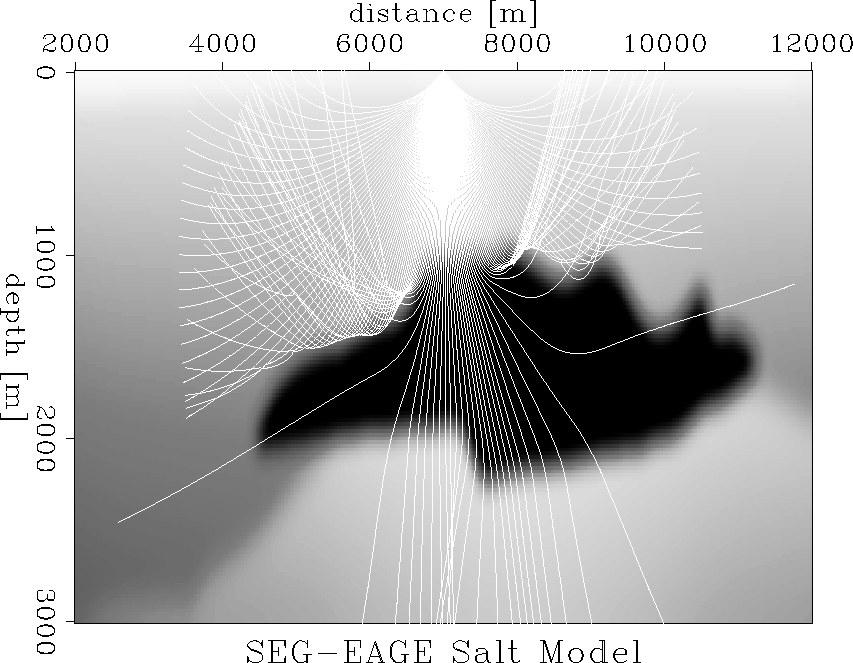
Figure 7 presents the distribution of rays obtained with paraxial ray tracing, and Figure 8 presents the distribution of rays obtained with Huygens wavefront tracing.
The strong lateral velocity variation leads to ray bending which, in turn, generates multiple arrivals. Some of the later arrivals are clearly separating from the main one, while others are following very close. Those close following arrivals might be generated by only one or two rays that get deviated from the others in their bundle. Such deviations may or may not be significant for the given velocity model, and depend on the level of smoothing applied to the model and on the ray tracing method. Therefore, the reliability and precision of our interpolation method depends on the precision and reliability on the ray tracing method.
 |
The precision also depends on the function we use to fit the data inside a triangle. For the current implementation we used a planar fit, which is satisfactory for the case of a dense ray coverage and of a fine sampling rate on each ray.
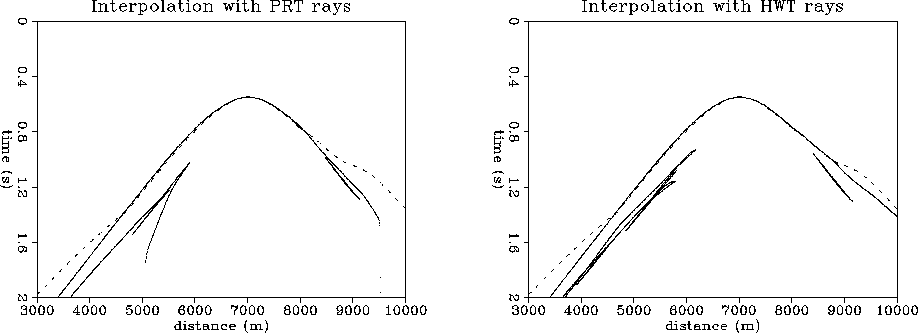
In Figure 9 we present the traveltimes computed at a depth of 1000m using our interpolation method on rays obtained with two different ray tracing methods, paraxial ray tracing and Huygens wavefront tracing Sava and Fomel (1997) (solid line). We compare our results with the solution to the eikonal equation Fomel (1997) (dashed line).
Unlike the eikonal solver, which only gives the first arrivals, though very accurately, the results of the interpolation method provide both first and later arrivals. The first arrival traveltimes are very close to each other except for the sides where the eikonal solution is dominated by the head waves generated in the salt. Other mismatches between the interpolation methods are caused by the different ray paths obtained with the ray tracing methods.