| vp2 (m/s) | vs2 (m/s) | ||
| 46 | 1661 - 0.6% | 440 + 2% | 2268 + 19.9% |
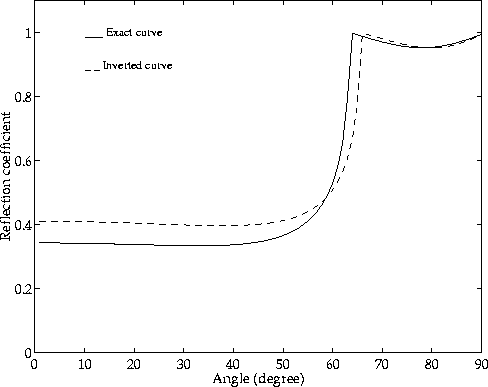
We used the pressure and vertical velocity component of the seafloor signal to invert for the near sea-floor parameters. The technique is the same as described before. The data were transformed into the frequency-radial wavenumber domain, the reflection coefficient was calculated and then inverted for the seafloor parameters. The inversion results can be seen in Table 8.
| vp2 (m/s) | vs2 (m/s) | ||
| 46 | 1661 - 0.6% | 440 + 2% | 2268 + 19.9% |
The inversion results show that the density is less well constrained and
has significant errors. P-wave velocity and S-wave velocity are reasonably
well determined. Figure 24 displays the theoretical
reflection coefficient versus the inverted one. It is obvious that most
discrepancy exists at pre-critical angles. This discrepancy is
caused by the large error
in the density, which mainly controls the near to pre-critical angles
(see sensitivity analysis).
|
vzpp1avo
Figure 24 Inverted AVO curve versus exact curve for P-Vz data. |  |